
- Short answer: market liquidity depends on how much capital the people who provide it have, and that capital depends on margins and on their losses. Brunnermeier and Pedersen show that the two feed each other, so liquidity can drop suddenly rather than fade.
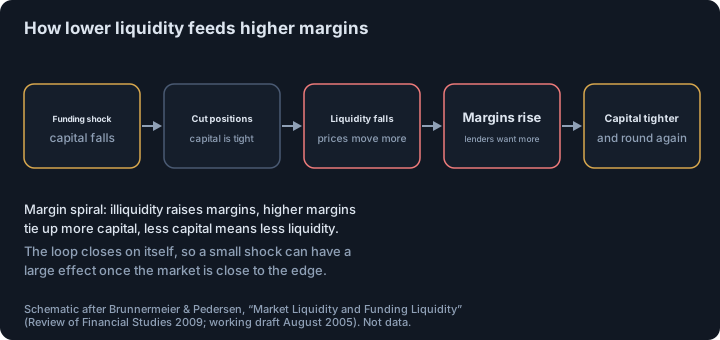
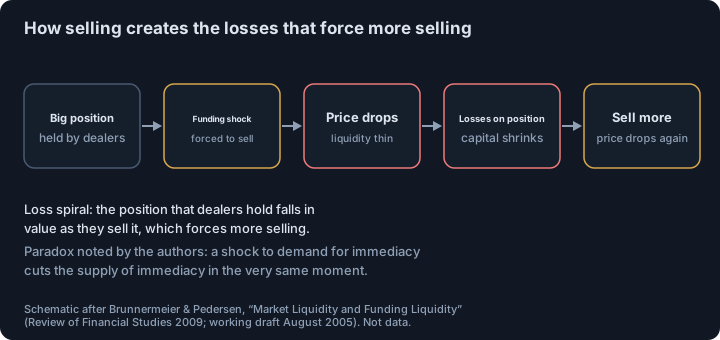
- Two spirals: a margin spiral (illiquidity raises margins, higher margins tie up capital, less capital means less liquidity) and a loss spiral (forced selling lowers prices and creates losses on the position, which forces more selling).
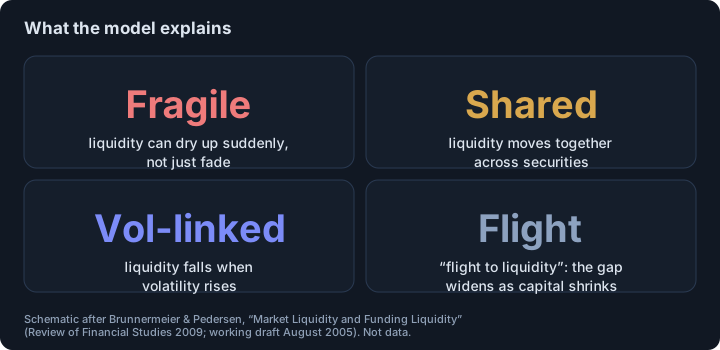
- The model explains five known features: liquidity can suddenly dry up, it is shared across securities, it falls with volatility, there is flight to liquidity, and it moves with the market. It is a theory paper: no new data, and no crypto in it.
- Margins can calm or inflame: they stabilize when lenders know the price drop is temporary, and destabilize when lenders cannot tell a liquidity shock from a fundamental one.
Short answer. Liquidity is not a constant property of a market. It is supplied by traders who need capital to do it, and in a crash their capital shrinks at the very moment demand for liquidity rises. Brunnermeier and Pedersen build a model in which the two forces reinforce each other in “liquidity spirals”, so that a market can look deep and then suddenly not be.1
What is funding liquidity, and why does it matter for market liquidity?
The paper distinguishes market liquidity, the ease of trading a security, from funding liquidity, how easily traders can obtain funds. When a trader buys a security he can use it as collateral, but he cannot borrow its full price: the difference is the margin, and it must come from his own capital. Short selling also requires margin. So at any time the total margin on all positions cannot exceed the trader’s capital.1
In the model, traders who provide liquidity (dealers, hedge funds, banks’ trading desks) bridge the gap between customers who must trade now and customers who arrive later. When their capital is abundant, markets are liquid and insensitive to small changes in capital. When they hit their capital constraint, or risk hitting it during a trade, they cut positions and market liquidity falls.1
What is the margin spiral?
Margins are usually set from the asset’s value-at-risk, the largest likely price drop within a confidence level.1 If illiquidity makes prices more volatile or less predictable, margins rise. That ties up more capital per position, reduces what dealers can hold, and lowers liquidity further. The paper calls this the margin spiral: illiquidity raises margins, higher margins tighten funding, tighter funding lowers liquidity, and so on.1
What is the loss spiral?
The second spiral does not need margins to change. If liquidity providers already hold a large position, which is often the case in downturns because market-making firms tend to be long the market, a funding shock forces them to sell. The price falls, the remaining position loses value, capital shrinks and they must sell more.1 The authors point out the paradox: a shock to customers’ demand for immediacy reduces the supply of immediacy in the same moment.1
Why can liquidity vanish suddenly?
Under a certain condition (loosely, that illiquidity raises margins or causes losses on dealers’ positions) the model has multiple equilibria: one in which markets are liquid and margins are low, and another in which markets are illiquid and margins are high. Whatever way one picks between them, there is a level of dealer funding at which liquidity drops discontinuously for an infinitesimal fall in funding.1 That is the model’s account of fragility: a market looks deep until funding slips below a threshold.
What else does the model explain?
The abstract lists five empirical features that the model reproduces: market liquidity (i) can suddenly dry up, (ii) is shared across securities, (iii) is related to volatility, (iv) shows “flight to liquidity”, and (v) moves with the market.1 For flight to liquidity, the intuition is that when capital is scarce traders concentrate on securities that need little margin, which are the low-volatility ones, so the liquidity gap between volatile and calm assets widens.1 And since market-making firms are often long, their capital limits bind in downturns, which is why sudden dry-ups tend to come when markets fall.1
When do margins stabilize and when do they destabilize?
The answer is about information. If financiers know a price drop comes from temporary illiquidity and that liquidity will return soon, a bigger price discount is a cushion against further falls, so margins can fall as illiquidity grows and they stabilize the price. If financiers cannot tell a fundamental shock from a liquidity shock, and volatility itself varies, margins can rise with illiquidity and destabilize the market.1 The authors add that a central bank that is better at telling the two apart can help; they cite the Federal Reserve Bank of New York’s action during the 1987 crash.1
What does this mean for crypto traders?
The paper models dealers, hedge funds and banks, not crypto exchanges, and we are not aware of a test of it on crypto in the sources we read. As a description of mechanism it fits what a leveraged market looks like in a fall:
- Positions are financed with margin, and an exchange’s margin and liquidation rules play the role of the financier’s rules. How that works on a perpetual contract is explained in futures liquidation and mark price versus last price; our liquidation feed records the forced orders as they happen.
- Forced selling pushes the price toward other traders’ liquidation levels, which is the loss spiral in miniature; see also auto-deleveraging and, in lending protocols, DeFi liquidations.
- Thin books in a fall are not necessarily panic: the people who normally provide depth may simply have run out of capital or risk budget. A historical example from a different market is in the 2010 flash crash.
- For your own account the lesson is symmetrical: margin you hold is the buffer that keeps you out of the spiral; the closer to the liquidation price you run, the more you depend on liquidity that may not be there.
This is educational material, not investment advice.
Related. The 2010 flash crash, futures liquidation explained.
Footnotes
-
Markus K. Brunnermeier and Lasse Heje Pedersen, “Market Liquidity and Funding Liquidity”, Review of Financial Studies (2009), DOI 10.1093/rfs/hhn098. We read the author working draft of August 2005 hosted at Princeton: the abstract, the introduction and the start of section 2; we did not check the model sections or the proofs, and the published version may differ in details. It is a theoretical model with no dataset of its own. ↩ ↩2 ↩3 ↩4 ↩5 ↩6 ↩7 ↩8 ↩9 ↩10 ↩11 ↩12 ↩13
Frequently asked questions
Why does liquidity disappear in a market crash?
Liquidity providers need capital to hold positions. When prices fall they lose capital, and lenders raise margins, so they must cut positions exactly when others need to sell. That lowers liquidity further, which in turn raises margins, creating a spiral.
What is a margin spiral?
A loop in which lower market liquidity raises the margins that financiers charge, higher margins tie up more of a trader’s capital, and less capital means the trader provides less liquidity. Brunnermeier and Pedersen show it can make liquidity fragile.
What is a loss spiral?
A loop in which liquidity providers hold a large position, a funding shock forces them to sell, the price falls, and the loss on the remaining position shrinks their capital and forces further selling.
Does this explain crypto liquidation cascades?
The mechanism is general: positions financed with margin, forced selling, falling prices. The paper models dealers and hedge funds and contains no crypto data, so it is an explanation of mechanism, not a test of any crypto episode.
Sources
- Market Liquidity and Funding Liquidity. Markus K. Brunnermeier and Lasse Heje Pedersen, Review of Financial Studies (2009), DOI 10.1093/rfs/hhn098; working draft of August 2005 (Princeton author copy; abstract, introduction and section 2 read), 2009
This article is research, not investment advice. Results on history do not guarantee future results.