
- Short answer: on 6 May 2010 a USD 4.1 billion sell program, run by an algorithm that targeted volume and ignored price and time, met an order book that had already thinned. Buy-side depth in the E-Mini fell to under 1% of its morning level, and prices dropped about 5% in minutes before recovering.
- The official CFTC and SEC staff report counts two liquidity crises: one in the E-Mini index futures, then a second in individual stocks, where over 20,000 trades in more than 300 securities printed more than 60% away from their prices moments before.
- High-frequency traders traded heavily but did not supply lasting depth: between 2:45:13 and 2:45:27 p.m. they traded over 27,000 contracts, about 49% of volume, while buying only about 200 net. The report warns that high volume is not necessarily a reliable indicator of liquidity.
- The report names retail stop-loss orders among the sell orders that hit thin buying interest in some stocks and ETFs after 2:45 p.m. The event is US equities and futures in 2010; the mechanics, not the numbers, carry over to other markets.
Short answer. On 6 May 2010 US stock indices fell about 5 to 6% in a few minutes and then recovered. The staff of the two US regulators, the CFTC and the SEC, traced it to a very large sell order executed by an algorithm into an order book that had already thinned. At the low, buy-side depth in the main index futures contract was under 1% of its morning level. It was a liquidity event, not a news event.1
What happened on 6 May 2010?
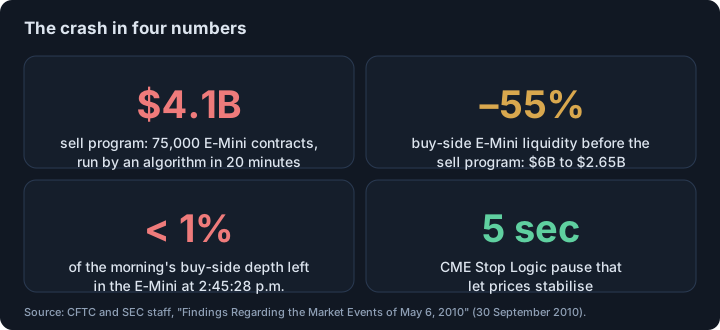
The day started turbulent, with European debt-crisis news. By 2:30 p.m. the VIX was up 22.5% from the open and the Dow was down about 2.5%. Buy-side depth in the E-Mini S&P 500 futures had fallen from nearly USD 6 billion in the early morning to USD 2.65 billion, a 55% decline.1
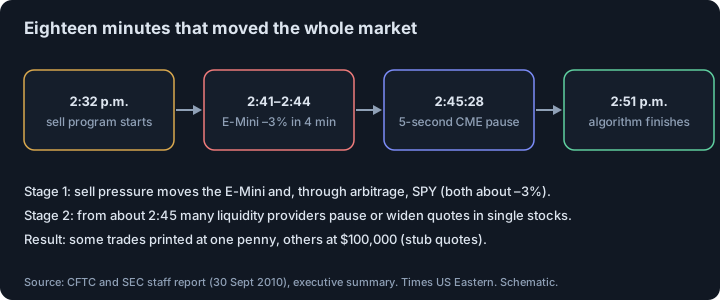
At 2:32 p.m. a large fundamental trader, a mutual fund complex, started a sell program of 75,000 E-Mini contracts, valued at about USD 4.1 billion, as a hedge for an existing equity position. It used an automated algorithm set to a 9% share of the previous minute’s trading volume, “without regard to price or time”. The report notes that when the same trader sold a similar amount earlier, it took more than five hours; this time the algorithm finished the first part in 20 minutes.1
Why did liquidity disappear?
The sell pressure was first absorbed by high-frequency traders, fundamental buyers and cross-market arbitrageurs. The algorithm sped up as volume rose, even though earlier orders had not been fully absorbed. The report puts it in one sentence: in volatile times, high trading volume “is not necessarily a reliable indicator of market liquidity”.1
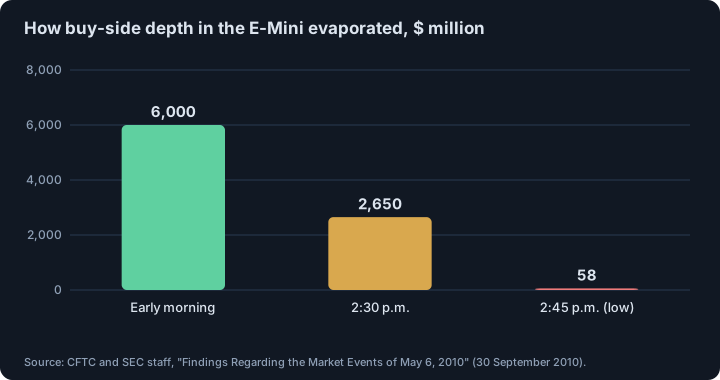
Part of the volume was recycling. Between 2:45:13 and 2:45:27 p.m. high-frequency traders traded over 27,000 contracts, about 49% of all volume, while buying only about 200 more than they sold: a “hot-potato” effect as the same positions passed between them. At 2:45:28 buy-side resting orders in the E-Mini were under 1,050 contracts, less than 1% of the morning depth, and buy-side depth was about USD 58 million.1
What stopped the fall?
At 2:45:28 trading in the E-Mini was paused for five seconds by the CME’s Stop Logic Functionality, which is designed to prevent cascades. When trading resumed at 2:45:33 prices stabilised and recovered. The sell algorithm continued until about 2:51 p.m., by then selling into a rising market.1
Why did some stocks trade at one penny?
The second liquidity crisis was in individual stocks, from about 2:45 p.m. Automated systems of many liquidity providers paused on the sudden price moves, and humans then had to assess risk. The report lists their questions: whether the moves were erroneous data, the effect on risk limits and profit and loss, the chance that trades would be cancelled, and system capacity. Some widened spreads, some reduced liquidity, a significant number withdrew completely.1
Orders kept arriving. The report names “many retail stop-loss orders”, triggered by price declines, among the sell orders that found reduced buying interest and pushed prices further down. Where the book was empty, market orders executed against stub quotes: over 20,000 trades in more than 300 securities printed more than 60% from their values moments before, some at one penny and some at USD 100,000.1 Between 2:40 and 3:00 p.m., about 2 billion shares traded, over USD 56 billion, and over 98% of the shares traded within 10% of their 2:40 price. The damage was concentrated, not universal.
What a trader can take from this
- Depth is not volume. A busy market can have almost no resting orders near the price, as the report shows for the E-Mini.
- Market orders walk a thin book. In a vacuum the fill price can be far from the screen price. We look at the cost of that in slippage and price impact.
- Stops are orders too. Stop-loss orders become market orders when triggered, so many of them at once add to the fall. Why price often recovers right after a stop is hit is in why price reverses after a stop-loss.
- Recovery does not help the stopped-out. Prices returned within minutes, but trades that executed at the worst prices were done.
- Resting orders can leave. Liquidity providers pause and withdraw when risk is unclear. For the cost of queue position and who fills your limit order, see why limit orders fill right before price moves against you.
The report covers US stocks and futures in 2010. It does not study crypto markets, and its numbers should not be applied to them.
This is educational material, not investment advice.
Footnotes
-
Staffs of the CFTC and the SEC, “Findings Regarding the Market Events of May 6, 2010”, report to the Joint Advisory Committee on Emerging Regulatory Issues, 30 September 2010 (executive summary read in full; the PDF was downloaded from the CFTC site). “What happened” (2:30 p.m. VIX, DJIA, E-Mini depth USD 6 billion to 2.65 billion; the 2:32 p.m. sell program of 75,000 contracts, USD 4.1 billion, 9% of volume, 5 hours before, 20 minutes now); “Liquidity crisis in the E-Mini” (about 3% in four minutes, 2:45:13 to 2:45:27 high-frequency volume, depth about USD 58 million and under 1,050 contracts, the 5-second Stop Logic pause at 2:45:28); “Liquidity crisis with respect to individual stocks” (pauses, widened spreads, retail stop-loss orders, over 20,000 trades in more than 300 securities more than 60% away, one penny to USD 100,000, stub quotes, 2 billion shares over USD 56 billion between 2:40 and 3:00 p.m.). The quoted phrases are from the executive summary. ↩ ↩2 ↩3 ↩4 ↩5 ↩6 ↩7 ↩8
Frequently asked questions
What caused the 2010 flash crash?
According to the CFTC and SEC staff report, a large mutual fund complex started a sell program of 75,000 E-Mini contracts (about USD 4.1 billion) at 2:32 p.m. through an algorithm that targeted 9% of recent volume without regard to price or time. Markets were already stressed and depth was thin, so the selling drove the E-Mini down about 3% in four minutes, and liquidity then vanished in individual stocks.
How far did prices fall and how fast did they recover?
The report says major indices, already down over 4% from the prior close, fell a further 5 to 6% in minutes and then rebounded almost as quickly, closing about 3% below the prior day. Over 20,000 trades in more than 300 securities executed more than 60% away from their prior values, some at one penny and some at USD 100,000.
What are stub quotes?
Stub quotes are quotes that market makers, or exchanges on their behalf, place far from the current market to meet two-sided quoting obligations when the market maker has withdrawn from active trading. When liquidity disappeared, market orders executed against them at irrational prices as low as one penny or as high as USD 100,000.
Did high-frequency traders cause the flash crash?
The report does not blame one group. It describes the algorithm as the trigger, and high-frequency traders as heavy traders who also sold to cut their inventory and passed contracts to each other in a hot-potato volume effect. It notes that high volume is not necessarily a reliable indicator of liquidity.
Does a flash crash matter for crypto traders?
The report covers US equities and futures in 2010, not crypto. The mechanism it describes, resting orders withdrawing as prices fall so that market orders walk a thin book, is general. Check depth, not just volume, before using market orders.
Sources
- Findings Regarding the Market Events of May 6, 2010. Staffs of the CFTC and the SEC, report to the Joint Advisory Committee on Emerging Regulatory Issues, 30 September 2010 (executive summary read in full), 2010
This article is research, not investment advice. Results on history do not guarantee future results.