
- Short answer: you can estimate when liquidity is thin from high and low prices alone, but not how much a trade costs. In Brauneis et al. (2021) the Corwin–Schultz and Abdi–Ranaldo estimators tracked the changes in real Bitcoin liquidity best (daily correlation 0.54–0.75 with spreads, 0.86 with price impact).
- For levels the picture reverses: the Amihud ratio and the Kyle–Obizhaeva estimator were best for the level of costs and for ranking exchanges, while Corwin–Schultz did poorly. No single measure was best on every task.
- Scale check: in the paper’s data the true quoted spread on Bitfinex averaged 0.72 basis points, while the daily Corwin–Schultz estimate averaged 21.6. On our own BTCUSDT hourly candles it is 15–34 basis points a year. Use it as a stress gauge, not as a price.
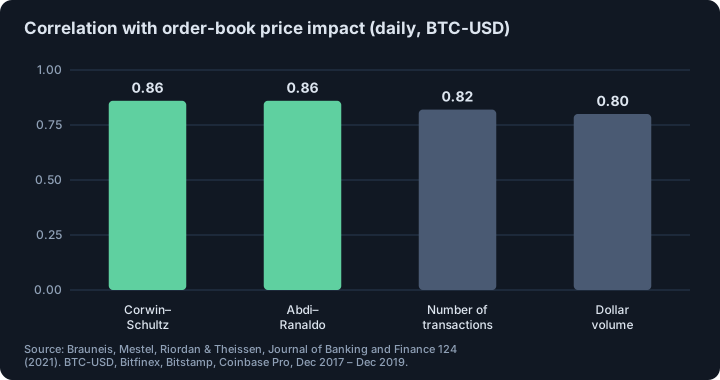
- Volume was not a safe proxy either: more trades and more dollar volume went with higher, not lower, execution costs (correlation 0.82 and 0.80 with price impact).
Short answer. Candles contain two things mixed together: how much the price moved and how wide the spread was. The Corwin–Schultz formula separates them using the high and low of two adjacent candles. A peer-reviewed test on Bitcoin and Ether found that it is among the best candle-based tools for seeing when liquidity worsens, and among the worst for saying how much a trade costs.1
Why would you need a spread without an order book?
Most exchanges give years of free candles and almost no history of the order book. If you want to know whether last year’s backtest traded in a market as liquid as today’s, or whether this hour is unusually thin, candles are what you have. The study’s authors take exactly this position: a researcher with open, high, low, close prices, a trade count and dollar volume.1
How does the Corwin–Schultz estimator work?
For two adjacent candles i and i+1, with highs H and lows L:1
- β = ln(H_i / L_i)² + ln(H_{i+1} / L_{i+1})²
- γ = ln(H_{i,i+1} / L_{i,i+1})², using the highest high and the lowest low of the two candles together
- α = (√(2β) − √β) / (3 − 2√2) − √(γ / (3 − 2√2))
- spread S = 2(e^α − 1) / (1 + e^α); negative values are set to zero
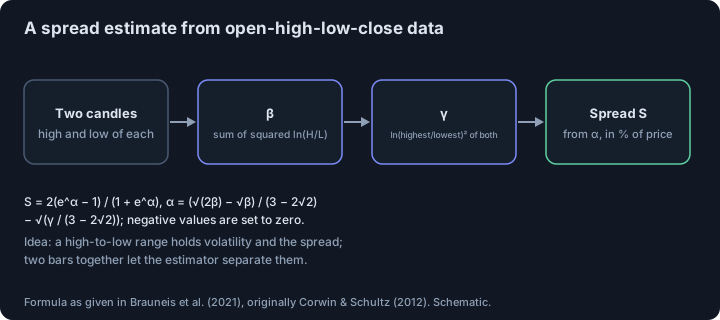
The idea is that a candle’s range grows with volatility proportionally to time, while the spread adds a roughly constant amount, so two candles together let the formula separate the two parts. A small example: candle 1 has high 100.50, low 100.00 and candle 2 has high 100.60, low 100.10. The formula gives about 25.8 basis points (our arithmetic). When the two-candle range is no wider than volatility alone would give, α turns negative and the estimate is set to zero.
The other formulas tested: Abdi–Ranaldo (uses high, low and close), the Amihud ratio (average absolute return divided by dollar volume), Roll’s estimator (from return autocorrelation) and the Kyle–Obizhaeva estimator.1
How was it tested?
The authors recorded every trade and the order book of BTC-USD and ETH-USD at Bitfinex, Bitstamp and Coinbase Pro from 16 December 2017 to 16 December 2019 (730 days), for example 37.1 million trades and 7.3 million order-book snapshots for BTC on Bitfinex. From these they built four benchmarks: quoted spread, effective spread, price impact and the cost of a round trip of about $32,100 for BTC. They then asked which candle-based measure best matches each benchmark, using 1-minute data for hourly estimates, hourly data for daily estimates and daily data for 15-day estimates.1
What did they find?
For tracking changes over time, on daily BTC-USD data, Corwin–Schultz and Abdi–Ranaldo came first and second: correlations with quoted spread, effective spread and round-trip cost ranged from 0.54 to 0.75, and with price impact 0.86. Both stayed good in high and low volatility, volume and return periods. The Amihud ratio was the worst on this task: virtually uncorrelated, even slightly negative.1
For levels and for ranking exchanges the roles swapped: the Amihud ratio and the Kyle–Obizhaeva estimator did best, and Corwin–Schultz and Abdi–Ranaldo did poorly. The paper’s conclusion is that there is no universally best measure but there are reasonably good ones: use Amihud or Kyle–Obizhaeva to pick the most liquid exchange or to estimate execution costs, and Corwin–Schultz or Abdi–Ranaldo to time liquidity.1 One footnote adds that Corwin–Schultz does very well for bitcoin and poorly for ethereum.1
Why did volume mislead?
The authors expected that more volume means a more liquid market. In their data the opposite held: the number of transactions and dollar volume were positively correlated with all four benchmarks (0.82 and 0.80 with price impact), so busier periods meant higher costs. That is exactly why the Amihud ratio, which assumes a given volume moves the price less in a liquid market, failed on this task. They note that a similar pattern has been documented for large US stocks.1 For how price impact relates to order flow, see order-flow imbalance and price impact.
What happens on a real perpetual contract?
We computed hourly Corwin–Schultz estimates on Binance USD-M BTCUSDT candles from October 2020 to October 2026. The yearly mean was 25.4 basis points in late 2020, 33.9 in 2021, 23.5 in 2022, 14.9 in 2023, 19.8 in 2024, 16.3 in 2025 and 15.5 in 2026 to date. About a third of the hourly estimates were zero.2
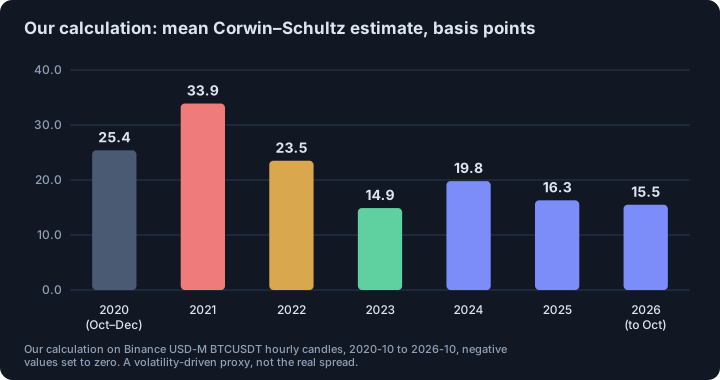
Compare that with the paper’s benchmark: the average quoted spread on Bitfinex was 0.72 basis points, the effective spread 1.04 and the round trip for a $32,100 trade 3.8, while the daily Corwin–Schultz estimate averaged 21.6 (Tables 3 and 4).1 So the level is an order of magnitude too high, as the authors’ finding on levels predicts. What the series does show is relative stress: 2021 was the thinnest year, 2023 the calmest. For real trading costs use slippage and price-impact estimates from actual fills.
What should a trader take from this?
- Use a candle-based estimate as a relative gauge: compare today’s value with its own 30-day median and flag spikes.
- Do not read it as a price. Average real spreads on Bitfinex and Coinbase Pro were below 1.2 basis points in the study.
- Do not use volume as a liquidity proxy without checking it against costs.
- To compare exchanges, use an Amihud-type ratio, not Corwin–Schultz.
- Caveat: two years of data from 2017–2019, spot BTC and ETH on three exchanges; the authors do not claim it carries over to other coins or to perpetual futures.
This is educational material, not investment advice.
Related. Slippage and price impact, order-flow imbalance and price impact.
Footnotes
-
Alexander Brauneis, Roland Mestel, Ryan Riordan and Erik Theissen, “How to measure the liquidity of cryptocurrency markets?”, Journal of Banking and Finance 124 (2021), 106041 (published open access, CC BY 4.0; read: abstract, section 2 with the formulas, Tables 1, 3 and 4, section 3.1, 3.6 and the conclusion). Daily correlation values are averages over the three exchanges (section 3.1); Table 3: Bitfinex BTCUSD daily means in basis points, quoted spread 0.721, effective spread 1.040, price impact 0.394, round trip 3.833; Table 4: Bitfinex daily Corwin–Schultz mean 21.63, Abdi–Ranaldo 23.60. ↩ ↩2 ↩3 ↩4 ↩5 ↩6 ↩7 ↩8 ↩9 ↩10
-
Our calculation: Corwin–Schultz estimate for every pair of adjacent hourly candles of Binance USD-M BTCUSDT (October 2020 to October 2026, 52,596 pairs), negative values set to zero, averaged by calendar year. The example with highs and lows 100.50/100.00 and 100.60/100.10 is our own arithmetic with the same formula. ↩
Frequently asked questions
How do you estimate the bid-ask spread from OHLC data?
The Corwin–Schultz estimator uses the high and low of two adjacent candles: it computes the sum of squared log high-to-low ranges and the squared log range of the two candles together, then solves for the spread. Negative results are set to zero.
Which low-frequency liquidity measure works best for Bitcoin?
It depends on the task. In a study of BTC-USD on three exchanges, Corwin–Schultz and Abdi–Ranaldo best followed changes in liquidity over time, while the Amihud ratio and the Kyle–Obizhaeva estimator best estimated levels and ranked exchanges.
Does high trading volume mean low trading costs in crypto?
Not in this sample. Both the number of transactions and dollar volume were positively correlated with execution costs (0.82 and 0.80 with price impact), so busy periods were costlier, which broke the logic of the Amihud ratio.
Can I use the Corwin–Schultz estimate as my real trading cost?
No. In the paper’s own data the real quoted spread on Bitfinex averaged 0.72 basis points while the daily estimate averaged 21.6. The estimator is useful for spotting when liquidity changes, not for the cost of a market order.
Sources
- How to measure the liquidity of cryptocurrency markets?. Alexander Brauneis, Roland Mestel, Ryan Riordan, Erik Theissen, Journal of Banking and Finance 124 (2021), 106041 (open access, CC BY 4.0; full text read), 2021
This article is research, not investment advice. Results on history do not guarantee future results.