
- Short answer: a 2019 peer-reviewed study (Hudson and Urquhart) tested 14,919 technical trading rules from five families on two Bitcoin prices, Litecoin, Ripple and Ethereum, with data to the end of 2017. After corrections for data snooping, many rules still showed significant returns, and many had breakeven transaction costs above 50 basis points.
- But only a small proportion of rules beat buy-and-hold on raw return in a sample dominated by rising prices; the rules looked better on risk-adjusted measures that penalise drawdowns, which the authors read as protection against long, severe drawdowns.
- The paper’s own out-of-sample test, the best in-sample rule applied to the first half of 2018, produced negative Sharpe ratios for both Bitcoin prices (-0.05 and -0.06) and positive ones for Ripple (1.36) and Ethereum (0.74). That window is six months of a bear market, so it is a hint, not a verdict.
- The support-resistance family was the weakest. The study says nothing about trading today with fees, leverage and slippage of your own; treat it as evidence that simple rules had an edge in crypto’s first years, not as a system.
Short answer. Do the simple rules from technical analysis, moving averages, breakouts, filters, work on crypto? A peer-reviewed study from 2019 tested nearly 15,000 of them on Bitcoin and four other coins and found significant predictability in every family, even after corrections for data snooping and with plausible costs. It also found that the rules rarely beat buy-and-hold on raw return in a rising market, and that the best rule failed for Bitcoin in the first half of 2018.1
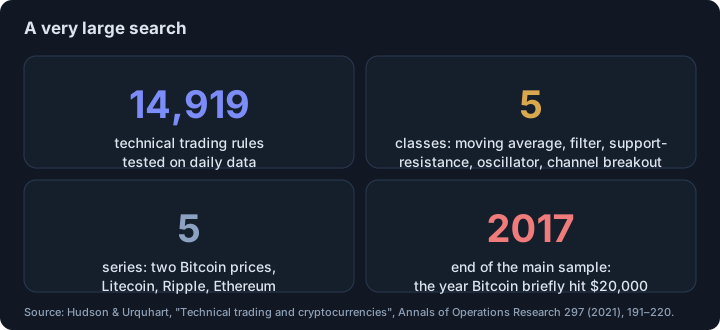
What did the authors test?
They followed an earlier design and tested five classes of rules: moving averages, filter rules (buy after a rise of a given percentage), support-resistance rules, oscillators and channel breakouts. Each class has many variants and parameters, for a total of 14,919 rules. The data are daily: CoinDesk’s Bitcoin price from 18 July 2010, Bitstamp from 1 December 2012, Litecoin and Ripple from 2013, Ethereum from August 2015, all to 31 December 2017.1
The authors note that moving-average rules are very similar to time-series momentum, with a correlation of returns above 0.80 in the literature they cite. For the evidence on trend rules in many markets over decades, see does trend following work?.
What did they find?
The average annualised return of each family of rules was statistically significant at the 5% level for each cryptocurrency. To limit data snooping they used the bootstrap method of Sullivan, Timmermann and White (1,000 stationary bootstrap resamples), then controlled the family-wise error rate and the false discovery rate. A large proportion of rules still showed significant returns afterwards.1 The key warning, from the same reasoning as in data snooping: is your best backtest just the luckiest?, is that the more rules you test, the more luck you find; here the authors did correct for it.
Do the profits survive costs?
The authors compute breakeven transaction costs, the cost per trade at which a rule’s profit is zero. They range from 7.88 basis points (the support-resistance rule in Litecoin) to 147.56 (the filter rule in Ethereum). For the two Bitcoin series the highest breakeven costs are 66.41 and 57.51 basis points. The paper cites Lintilhac and Tourin (2017) for a cost of about 50 basis points for Bitcoin, and finds that a large proportion of rules clear it, with the exception of the support-resistance family, which it says is not very successful in any of the four coins.1
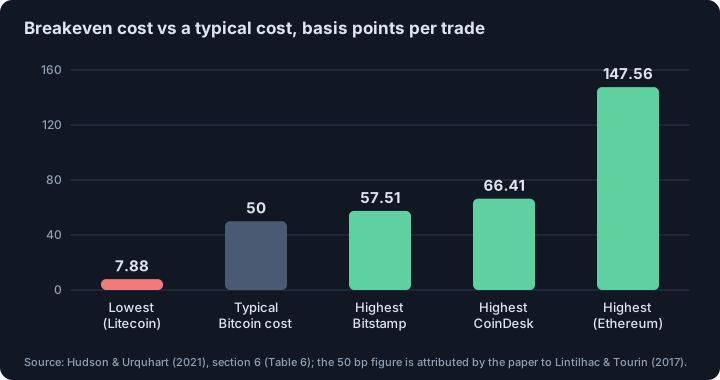
Did the rules beat buy-and-hold?
This is where the evidence is more sober. Crypto prices trended up strongly over the sample, so buy-and-hold was hard to beat: “only a small proportion of rules generate annualized returns greater than the buy-and-hold strategy”. On risk-adjusted measures that capture downside risk, the Sortino and Calmar ratios, substantially more rules beat it, which the authors read as avoiding the large, severe and lengthy drawdowns of cryptocurrencies and giving smoother returns.1
What happened out of sample?
The first draft of the paper used data to 31 December 2017. By July 2018 Bitcoin, which had briefly hit USD 20,000, was around USD 6,500, so the authors could do a pure out-of-sample test: take the best in-sample rule for each coin and apply it to the first six months of 2018. The best rules for both Bitcoin prices and for Litecoin were channel breakouts, for Ripple and Ethereum moving averages.1
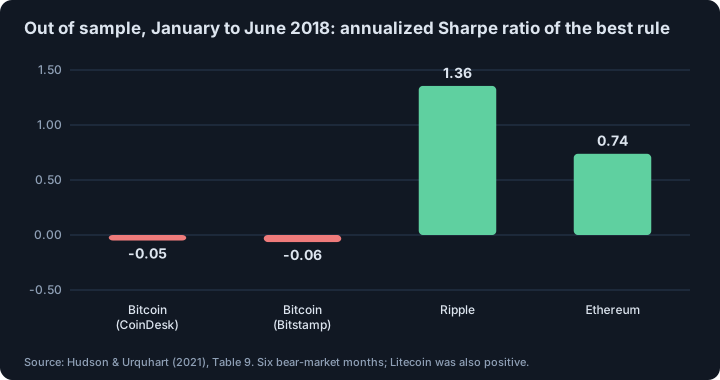
For both Bitcoin prices the out-of-sample annualised return and Sharpe ratio were negative (Sharpe -0.05 for CoinDesk and -0.06 for Bitstamp). For Ripple the Sharpe ratio was 1.36 and for Ethereum 0.74, and Litecoin also was positive. The authors conclude Bitcoin may not be profitable to trade with technical analysis out of sample, while the other coins still generated substantial returns.
How should we read this?
- A single best rule is a thin test. Picking the best of almost 15,000 rules and trying it on six months is a harsh and noisy test. The authors flag that the choice of in-sample and out-of-sample periods matters and that rule performance tends to diminish over time and after publication.
- The sample is a boom. Prices of the coins rose strongly. That makes “beat buy-and-hold” a high bar and “beat zero” an easy one.
- Rule families differ. Trend-following types did the work; support-resistance rules did not.
- Costs of your own. The paper used a cost range; leverage, funding and slippage on your venue change the answer. How costly a market order can be is in slippage and price impact.
What a trader can take from this
- Demand an out-of-sample test. In-sample results from thousands of variants are what why most backtests overstate results warns about.
- Judge by drawdown, not just return. The one consistent advantage here was smoother paths, not higher raw return.
- Match the rule to the claim. A chart pattern claimed to be proven by a single post is a different thing from a tested family of rules; see a broken trendline and a negative Coinbase premium for what that looks like.
- Do not generalise the 2018 result either. Six months is not a verdict in either direction.
This is educational material, not investment advice.
Footnotes
-
Hudson, R., Urquhart, A., “Technical trading and cryptocurrencies”, Annals of Operations Research 297 (2021), 191–220, online 30 August 2019 (open access; full text of the PDF read). Abstract and introduction: 14,919 rules, five classes, five series, significance in each family, breakeven costs, multiple-testing corrections, drawdown protection, no Bitcoin predictability out of sample. Data: CoinDesk from 18 July 2010, Bitstamp from 1 December 2012, Litecoin and Ripple 2013, Ethereum August 2015, to 31 December 2017. Section 3: the five rule classes. Section 6: breakeven costs (7.88 to 147.56 basis points; 66.41 and 57.51 for the Bitcoin series; about 50 basis points from Lintilhac and Tourin 2017; the weakness of support-resistance rules), comparison with buy-and-hold (only a small proportion beat it on raw return; more on Sortino and Calmar). Out-of-sample section: first half of 2018, Table 9 (Sharpe ratios -0.0502, -0.0641, 1.3553 and 0.7380 for the CoinDesk, Bitstamp, Ripple and Ethereum series; the Litecoin row is positive per the text). ↩ ↩2 ↩3 ↩4 ↩5 ↩6
Frequently asked questions
Do technical trading rules work on Bitcoin?
In the Hudson and Urquhart study, which tested 14,919 rules on data to 31 December 2017, rules from each of five families showed significant average returns, and a large share survived multiple-testing corrections. But in a pure out-of-sample test on the first half of 2018, the best in-sample rule had negative Sharpe ratios for both Bitcoin prices, so the authors report no predictability for Bitcoin out of sample.
Do the rules beat buy-and-hold?
Mostly not on raw returns: the paper says only a small proportion of rules generated annualised returns greater than buy-and-hold in a period of rising prices. On risk-adjusted measures that capture downside risk, such as the Sortino and Calmar ratios, substantially more rules did, which the authors read as avoiding the large, severe and lengthy drawdowns of cryptocurrencies.
Do the profits survive transaction costs?
For many rules, according to the paper. Breakeven costs ranged from 7.88 basis points (support-resistance, Litecoin) to 147.56 (filter rule, Ethereum); for the two Bitcoin series the highest were 66.41 and 57.51. The paper cites about 50 basis points as a Bitcoin trading cost and finds a large proportion of rules above that, except support-resistance rules.
What is data snooping and how did the study handle it?
Testing thousands of rules makes it likely that some look good by luck. The authors used bootstrapped p-values (Sullivan, Timmermann and White 1999) with 1,000 resamples, then controlled the family-wise error rate and the false discovery rate. A large proportion of rules still reported significant returns afterwards.
Does this mean I can trade crypto with moving averages today?
No. The main sample ends in 2017, the window after it is short, and the study does not model your costs, leverage or slippage. Trend-style rules are discussed with long-run evidence from other markets in our article on trend following; the point here is that a rule must pass out-of-sample tests.
Sources
- Technical trading and cryptocurrencies. Robert Hudson, Andrew Urquhart. Annals of Operations Research 297 (2021), 191–220; online 30 August 2019, open access (full text read), 2021
This article is research, not investment advice. Results on history do not guarantee future results.