
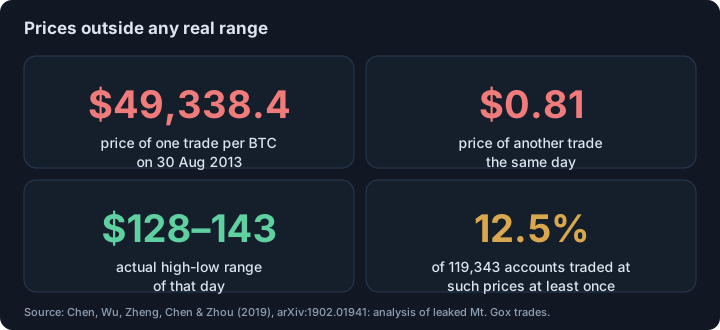
- Short answer: a 2019 preprint analysed the leaked trade history of Mt. Gox, April 2011 to November 2013, 6.7 million completed trades and 119,343 accounts. It found 14,916 accounts (12.5%) that at least once traded at prices outside any real range, for example USD 49,338.4 and USD 0.81 per bitcoin on a day when the real range was USD 128.56 to 142.76.
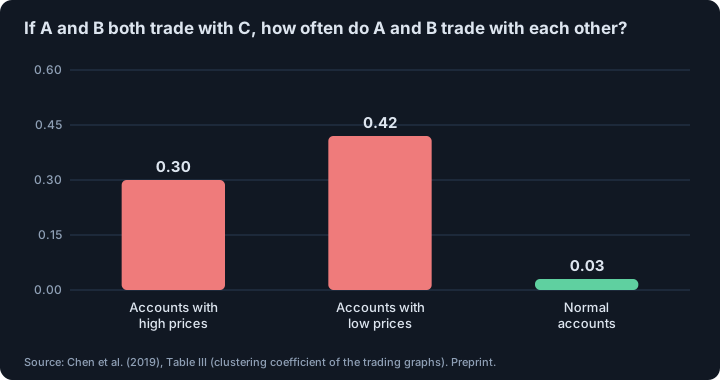
- These accounts also traded with each other in unusual patterns: one account made 749 trades with itself on 7 February 2013, another made 322 sells to one account on 15 August 2013. Their trading graph is far more clustered (0.30 and 0.42) than that of normal accounts (0.03).
- The authors read this as evidence of accounts controlled by one party and of market manipulation, and they note two possible purposes: fake volume, or providing liquidity. This is their interpretation of leaked, unverified data in an arXiv preprint, not a court finding.
- The paper reports that the abnormal accounts’ trading correlates with the Bitcoin price. Correlation in a leaked data set does not by itself prove what moved the price.
Short answer. Mt. Gox was once the world’s leading Bitcoin exchange. Its internal trade history later leaked as CSV files, and a group of researchers analysed it. They found trades at prices that no real market could produce, and accounts trading with themselves and each other in patterns that ordinary customers do not make. They call this evidence of market manipulation; the honest reading is that it is strong anomaly evidence from leaked data, interpreted by the authors.1
What data did the researchers have?
The data are trade histories of Mt. Gox from April 2011 to November 2013 that leaked as CSV files. After cleaning, about 18 million rows came down to 13.5 million rows, or 6.7 million completed trades (6,775,117) between 119,343 accounts. The authors note that Mt. Gox was, before it filed for bankruptcy protection in February 2014, the largest Bitcoin intermediary in the world. They matched each trade’s price to the reference exchange rate of the day.1
The authors treat the leaked files as a genuine record. We cannot check that, so everything below is conditional on it.
What are the impossible prices?
Comparing each trade with that day’s reference range, they found trades far outside it. On 30 August 2013 one trade (ID 1377875127221631) was at USD 49,338.4 per bitcoin and another (ID 1377876535345547) at only USD 0.81, while on the same day the highest and lowest prices in the downloaded exchange-rate data were USD 142.76 and USD 128.56.1
They define extremely high accounts (trading at very high prices at least once), extremely low accounts, and normal accounts. In total 14,916 accounts, 12.5% of all, were abnormal. Abnormal-price trades were 194,790, or 2.8% of all trades; since this share is not tiny, the authors argue the trades are not accidents, and since no ordinary user could trade at such a price, they consider these accounts under the control of the exchange. That last step is their inference.
What do the abnormal accounts do the rest of the time?
Mostly they trade normally. Abnormal accounts took part in 3,025,992 trades, and normal-priced trades among abnormal accounts alone made up more than 41% of all trades on the exchange. The authors offer two possible purposes: creating fake volume to give an illusion of active trading, or providing liquidity for the exchange.1
What patterns do they find in the network?
The authors built a graph in which each account is a node. Abnormal accounts trade with each other far more densely than normal ones: the clustering coefficient, which says how likely two partners of an account are to trade with each other, is 0.30 for extremely high accounts and 0.42 for extremely low accounts, against 0.03 for normal accounts. The average number of trading partners is 19.89 and 70.93 for the abnormal groups against 7.59 for normal accounts.1
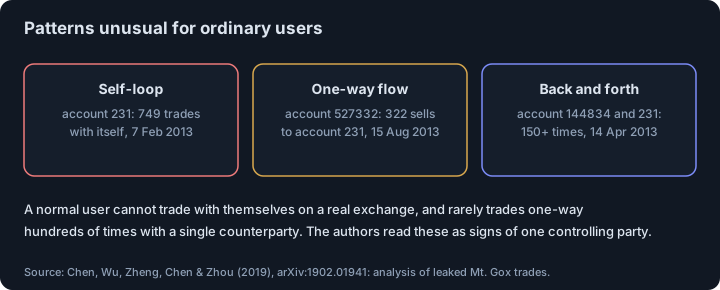
They also show typical patterns: a self-loop (on 7 February 2013, account 231 made 749 trades with itself), a one-way flow (on 15 August 2013, account 527332 made 322 sell trades to account 231) and a back-and-forth pattern (on 14 April 2013, account 144834 interacted with account 231 more than 150 times). A user cannot trade with themselves on a normal exchange, and the authors treat such patterns as signs of accounts controlled by one party.
Did it move the price?
The authors apply singular value decomposition to the daily graph snapshots to find “base networks” whose activity correlates with the Bitcoin price, and report that the base networks of the abnormal accounts have a strong correlation with the exchange rate while those of normal accounts do not. They conclude there was serious market manipulation on Mt. Gox.1 We would be careful: this is a correlation between two time series in a leaked data set from a period when the price rose from about USD 10 to over USD 1,000 and then fell back below USD 200, as the paper’s own chart shows. It is suggestive, not a proof of cause.
What a trader can take from this
- Volume on one exchange can hide non-customer trades. Related evidence on inflated volume is in fake volume on crypto exchanges.
- A big exchange is not a safe exchange. How often exchanges fail, and why size did not protect against everything, is in crypto exchange failure risk.
- Be careful with “signals” from unverifiable data. The same caution applies to coordinated promotions; see how a crypto pump-and-dump works.
- Anomalies are leads, not verdicts. The authors give two possible purposes for the strange trades; the data do not tell you which one, or anyone’s intent.
- Keep the era in mind. Everything here is 2011 to 2013, one exchange.
This article describes a published preprint and makes no accusation against any person or company.
This is educational material, not investment advice.
Footnotes
-
Chen, W., Wu, J., Zheng, Z., Chen, C., Zhou, Y., “Market Manipulation of Bitcoin: Evidence from Mining the Mt. Gox Transaction Network”, arXiv:1902.01941v1 (19 January 2019), preprint; full text of the PDF read. Abstract and introduction: leaked transaction history, Mt. Gox before the February 2014 bankruptcy filing, price from about USD 10 to over 1,000 and below 200 (Fig. 1). Section II: data cleaning (about 18 million rows to 13.5 million, 6.7 million completed trades), the trades on 30 August 2013 at USD 49,338.4 and USD 0.81 against a range of USD 128.56 to 142.76, Table II (119,343 accounts, 6,775,117 trades, 14,916 abnormal accounts, 12.5%, 194,790 abnormal trades, 2.8%, 3,025,992 trades of abnormal accounts, over 41% normal trades among them), Findings 1 to 3. Section III: Table III (clustering 0.30, 0.42, 0.03; average degree 19.89, 70.93, 7.59). Section IV: base networks via singular value decomposition, Findings 4 to 6, the patterns (self-loop: account 231, 749 trades, 7 February 2013; one-way: account 527332, 322 sells to account 231, 15 August 2013; bidirectional: account 144834, more than 150 times, 14 April 2013). ↩ ↩2 ↩3 ↩4 ↩5 ↩6
Frequently asked questions
What did the leaked Mt. Gox data show?
According to a 2019 preprint by Chen and co-authors, the leaked trade history (April 2011 to November 2013, 6,775,117 completed trades, 119,343 accounts) contains 14,916 abnormal accounts, 12.5% of all accounts, that at least once traded at prices far outside the day’s range. On 30 August 2013 one trade was at USD 49,338.4 per bitcoin and another at USD 0.81, while the day’s range was USD 128.56 to 142.76.
Were the abnormal accounts manipulating the Bitcoin price?
The authors conclude there was serious market manipulation on Mt. Gox, based on the abnormal prices, unusual trade patterns and a correlation between the abnormal accounts’ trading networks and the price. This is the authors’ interpretation of leaked data in a preprint. They also note that two purposes are possible for the odd trades: creating fake volume or providing liquidity to the exchange.
What are self-loop and bidirectional trade patterns?
A self-loop is an account that trades with itself: the paper shows an account with 749 trades with itself on 7 February 2013, which it says is restricted for normal accounts on any exchange. A bidirectional pattern is two accounts trading back and forth many times: on 14 April 2013 two accounts interacted more than 150 times. The authors read these as signs of one controlling party.
How reliable is leaked exchange data?
Its authenticity cannot be independently verified here. The authors treat the leaked CSV files as a real record after cleaning (about 18 million rows reduced to 13.5 million, or 6.7 million completed trades), and their conclusions depend on that assumption. Readers should treat the findings as a research hypothesis, not as an established fact about any person or company.
Why does this matter for crypto traders today?
It shows that volume and price on a single exchange can be affected by trades that are not ordinary customers’ trades, and that data analysis can flag them. Related topics are fake volume on exchanges and the risk of an exchange failing. The study covers 2011 to 2013 on one exchange and says nothing about current ones.
Sources
- Market Manipulation of Bitcoin: Evidence from Mining the Mt. Gox Transaction Network. Weili Chen, Jun Wu, Zibin Zheng, Chuan Chen, Yuren Zhou. arXiv:1902.01941v1 [q-fin.GN], 19 January 2019; preprint (full text read), 2019
This article is research, not investment advice. Results on history do not guarantee future results.