
- Short answer: Bitcoin returns have much fatter tails than a normal curve. In our Binance BTCUSDT daily data (2,583 days) 38 days moved more than 3 standard deviations against 7 expected, 12 beyond 4 against 0.16, and 3 beyond 5 against 0.0015.
- An arXiv study of 5-hour BTC-USD returns (2013–2020) reports kurtosis 72.64, skewness −2.93 and a tail exponent of 3.49 ± 0.02, close to the value of about 3 found for stocks and currencies.
- Big days cluster: in our data the day after a move beyond 2 standard deviations had a mean absolute move of 0.96 standard deviations against 0.64 otherwise, and the autocorrelation of absolute returns is 0.16 at one day and still 0.05 at twenty.
- Practical meaning: risk numbers that assume a normal curve understate extreme days; the direction of a day is hard to predict, its size is not.
Short answer. A normal curve says a daily move beyond 5 standard deviations should come about once in 4,800 years. In seven years of daily Bitcoin-futures data it happened three times. The size of Bitcoin’s extreme days is not a fluke of one episode; it matches the tail shape that published studies find, and it comes with a second feature that matters for trading: big days arrive in groups.
How often are Bitcoin’s extreme days, compared with a normal curve?
We took Binance USD-M BTCUSDT daily closes from 9 September 2019 to 4 October 2026 (2,583 daily log returns, standard deviation 3.2% a day) and counted days that moved more than k standard deviations from the average:1
| Beyond | Days observed | Expected under a normal curve |
|---|---|---|
| 3 standard deviations | 38 | 7.0 |
| 4 standard deviations | 12 | 0.16 |
| 5 standard deviations | 3 | 0.0015 |
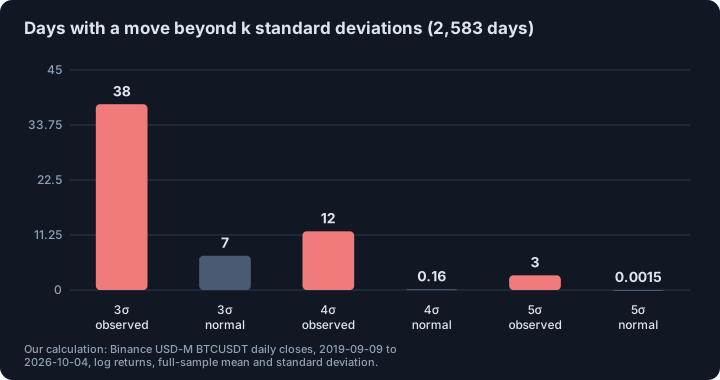
The worst day was 12 March 2020: the price fell from 7,938 to 4,765 (−40%, a log return of −51%), which is 15.9 standard deviations. The sample standard deviation itself is inflated by such days, so the table understates how unusual they are relative to a calm-period yardstick. The other two 5-sigma days were 8 February 2021 (price +19.6%) and 13 June 2022 (price −15.4%).1
What does a published study find?
The arXiv study of de Sousa Filho, Silva, Bertella and Brigatti used 13,246 five-hour BTC-USD returns on Bitstamp from 31 March 2013 to 19 October 2020. It reports a standard deviation of 0.032, skewness of −2.93 and kurtosis of 72.64 (a normal curve has 3). The tail index of the distribution of absolute standardized returns is 3.49 ± 0.02, which the authors compare with values near 3 found for foreign-exchange and stock markets.2
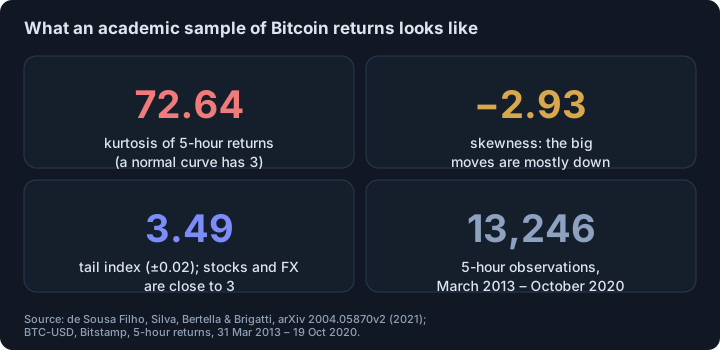
A tail index near 3 means that the probability of a move of size x falls roughly as x⁻³: doubling the size cuts the probability by about eight, where a normal curve cuts it by many orders of magnitude. The authors also note that studies on higher-frequency data record even heavier tails (index below 2.5), and that between the Mt. Gox failure (February 2014) and late 2015 the series looked closer to Gaussian, with the deviations returning later.2 The study is a preprint: we cite it as evidence, not as settled fact.
What is volatility clustering?
Return direction is nearly unpredictable, but size is not. In the arXiv study the autocorrelation of absolute returns is 0.39 at lag 1 on 5-hour data and decays slowly, following a power law with exponent 0.31 for absolute returns and 0.72 for squared returns.2 In our daily data the autocorrelation of absolute returns is 0.16 at one day, 0.10 at five, 0.07 at ten, 0.05 at twenty and 0.01 at fifty days, while the autocorrelation of signed returns at lag 1 is −0.07.1
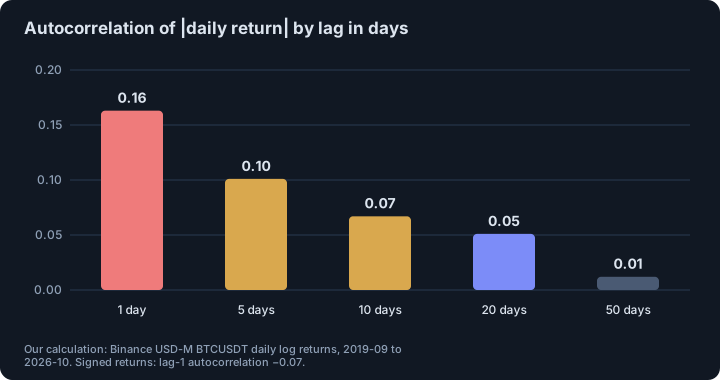
A simple check of the effect: after the 140 days that moved more than 2 standard deviations, the next day’s mean absolute move was 0.96 standard deviations; after all other days it was 0.64.1 Big days attract big days, which is why risk is highest immediately after a shock, the same pattern behind liquidation cascades.
Is there a leverage effect?
The same study finds a negative correlation between returns and later volatility, the “leverage effect” known from stocks: volatility rises after falls. Its decay time is slightly longer than 2 days, compared with about 10 days for stock indices and 50 days for single stocks in the literature the authors cite. They contrast this with fiat exchange rates, where the effect is considered negligible, and with earlier Bitcoin studies that found none.2
What should a trader take from this?
- Do not size risk from a normal-curve model. A “3-sigma stop” will be hit far more often than the textbook rate; a 5-sigma day should be in your stress test, not in your “impossible” list.
- Treat volatility as forecastable and direction as not. A good volatility forecast can improve position size and stop distance; use recent realized volatility as the input, and remember that real fills in a fast market are worse, see slippage and price impact.
- Expect clusters. After a big move, widen risk assumptions rather than reverting to the calm-period average.
- Run enough trades and enough regimes before trusting an average; see how many trades are needed.
- Caveats: one asset, seven years of futures data for our table, a 2013–2020 preprint for the published numbers; tail indexes depend on the sampling interval.
This is educational material, not investment advice.
Related. How many trades you need to validate a strategy, futures liquidation explained.
Footnotes
-
Our calculation: Binance USD-M BTCUSDT daily closes, 2019-09-09 to 2026-10-04, 2,583 log returns, standardized with the full-sample mean and standard deviation; expected counts are 2,583 × 2 × (1 − Φ(k)); for k = 5 the daily probability is 5.7 × 10⁻⁷, about one day in 1.74 million, or 4,800 years of daily data. The two other 5-sigma days are 2021-02-08 and 2022-06-13; the autocorrelations are sample autocorrelations of absolute and signed daily log returns. ↩ ↩2 ↩3 ↩4
-
F. N. M. de Sousa Filho, J. N. Silva, M. A. Bertella and E. Brigatti, “The leverage effect and other stylized facts displayed by Bitcoin returns”, arXiv:2004.05870v2 (2021), preprint; read in full (sections 2–5): Bitstamp BTC-USD, 5-hour sampling, 13,246 observations; kurtosis, skewness and tail index from section 4.1; autocorrelation exponents and leverage effect from sections 4.1–4.2 and 5. ↩ ↩2 ↩3 ↩4
Frequently asked questions
Are Bitcoin returns normally distributed?
No. In our Binance BTCUSDT daily data, 38 of 2,583 days moved more than 3 standard deviations where a normal curve predicts about 7, and 3 days moved more than 5 standard deviations where it predicts essentially none.
What is a fat tail in trading?
It means extreme moves are far more likely than a bell curve implies. An arXiv study of Bitcoin 5-hour returns finds a tail exponent of 3.49, meaning the chance of a move falls roughly with the cube of its size, much more slowly than for a normal distribution.
What is volatility clustering?
Large moves tend to follow large moves and small ones follow small ones. In our Bitcoin data the autocorrelation of absolute daily returns is 0.16 after one day and 0.05 after twenty, while the autocorrelation of signed returns is near zero.
Why does it matter for stop-losses and position size?
A stop or a size derived from a normal-curve volatility estimate underestimates the frequency of extreme days, and because volatility clusters, the risk is highest right after a big move. The forecast of size is more reliable than the forecast of direction.
Sources
- The leverage effect and other stylized facts displayed by Bitcoin returns. F. N. M. de Sousa Filho, J. N. Silva, M. A. Bertella and E. Brigatti, arXiv:2004.05870v2 (31 January 2021), preprint, full text read, 2021
This article is research, not investment advice. Results on history do not guarantee future results.