
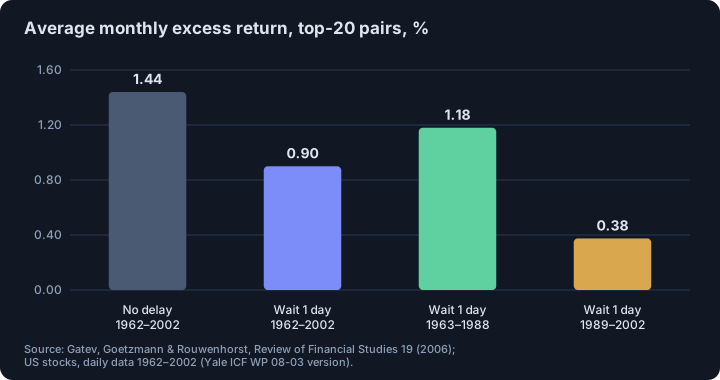
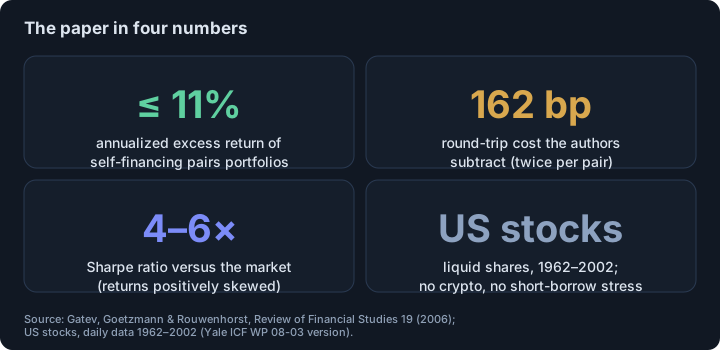
- Short answer: it worked on US stocks in 1962–2002, with excess returns of up to 11% a year before the authors’ conservative cost estimate; about 1.2% a month for the top 20 pairs in 1963–1988 and about 0.4% a month in 1989–2002 (one-day delay).
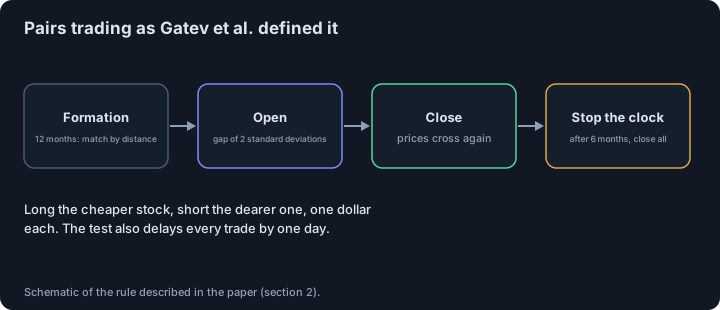
- The rule is mechanical: match stocks by the distance between normalized prices over 12 months, open a long-short pair when it diverges by two standard deviations, close when prices cross, stop after six months.
- Costs decide it: waiting one day to trade cut the top-20 return from 1.44% to 0.90% a month. The authors subtract 162 basis points per round trip and still find 113–225 basis points of net profit per six months.
- This is evidence about large US stocks, not crypto. Nothing in the paper says the same profit exists on coins, and the later fall in returns is itself a warning.
Short answer. The standard test says yes for 1962–2002, with caveats. Gatev, Goetzmann and Rouwenhorst took a rule that traders actually used, applied it mechanically to US stocks and found excess returns that survived their conservative transaction-cost estimate. The same paper also shows the profits shrinking sharply after 1988.1
What is the rule?
Pairs trading is easier to test than to describe because it has few moving parts:1
- Formation (12 months). For each liquid stock, build a cumulative total-return index and choose the partner stock that minimizes the sum of squared differences between the two normalized series. Stocks with any non-trading day are excluded.
- Trading (next 6 months). Study the best 5 and the best 20 pairs, plus pairs 101–120 as a control. Open a pair when normalized prices diverge by more than two historical standard deviations (measured in the formation period): short one dollar of the higher-priced stock, long one dollar of the lower. Close at the next crossing; if no crossing occurs, close on the last day of the six months.
- Delay. Because trading at the very moment of divergence can exploit the bid-ask bounce, the authors also wait one day before opening and closing.
What did they find?
Over 1962–2002 daily data, the abstract reports average annualized excess returns of up to 11% for self-financing portfolios of pairs, profits that typically exceed conservative transaction-cost estimates, and a pairs effect that differs from known reversal profits.1 In the unrestricted top-20 portfolio the average monthly excess return was 1.44% with no delay and 0.90% when trades wait one day.1
The authors treat the gap between those two figures as an indirect estimate of costs: a one-day delay cost 324 basis points per six months, which at about two round trips per pair implies 162 basis points per round trip (an effective spread of about 81 basis points per stock). They subtract it from profits of 437–549 basis points per six months and get net profits of 113–225 basis points.1
Why did profits fall?
Split into two halves, the one-day-delay top-20 portfolio earned 1.18% a month from July 1963 to December 1988 and 0.375% a month from 1989 to 2002; the top-5 portfolio went from 1.03% to 0.22%.1 The authors name two possible reasons: falling transaction costs and the rise of hedge funds in relative-value strategies, which may together have lowered the return of this simple form of the trade.1 They also note that risk-adjusted returns were more stable than raw returns over time.1
How risky is it, according to the paper?
For 1963–2002 the average excess return of pairs trading was about twice that of the S&P 500 with only one half to one third of the risk, so Sharpe ratios were 4 to 6 times the market’s; returns were positively skewed.1 In 1963–1988 the pair portfolios had negative loadings on the market and on the size factor (about −0.3 for the top-20 portfolio).1 The profits were positive in all four broad sectors tested, from 0.58% a month in transportation to 1.08% in utilities for the top-20 pairs (one-day delay).1
On short selling, the authors repeat the test with large stocks only and with simulated short recalls on high-volume days. The top-20 portfolio still earned 85 basis points a month with recalls, with a t-statistic of 9.07.1
What does the study not tell you?
- Crypto. The paper covers US stocks from 1962 to 2002. It says nothing about coins, perpetual-futures funding, exchange risk or the short-term correlations of crypto assets.
- Period. The test stops in 2002 and the profit had already shrunk in the second half. We have not read a later replication and make no claim about the present.
- Rule details. The authors themselves note that opening at two standard deviations of a historical estimate probably opens pairs “too soon” and trades too much near the end of a window.1
- Selection. Pairs are chosen by distance in the past, which tends to match stocks in the same sector, often utilities; the “top” pairs are not a random sample of the market.
What should a trader take from this?
- Treat costs as part of the strategy: a one-day delay was enough to cut the return by more than a third.
- Test any pairs idea on a period that comes after the one used to choose the rule, see how to avoid backtest traps and how many trades are enough.
- Do not assume that the mean reversion in two prices is guaranteed to continue: in the paper itself the profit was lower in the later years.
- For crypto, compare the cost side first: slippage and price impact and the funding payments of perpetual futures can eat the small edges of a market-neutral trade.
This is educational material, not investment advice.
Related. Why crypto arbitrage gaps persist, slippage and price impact.
Footnotes
-
Evan Gatev, William N. Goetzmann and K. Geert Rouwenhorst, “Pairs Trading: Performance of a Relative-Value Arbitrage Rule”, Review of Financial Studies 19(3), 797–827 (2006); read in full as Yale ICF Working Paper No. 08-03 (February 2006): abstract, section 2 (method), 3.3 (transaction costs), 3.4 (sectors), 3.5 (risk), 3.8 (sub-periods), 3.9 (short selling), conclusion, Table 8. The journal text may differ from the working paper in details. ↩ ↩2 ↩3 ↩4 ↩5 ↩6 ↩7 ↩8 ↩9 ↩10 ↩11 ↩12 ↩13
Frequently asked questions
What is pairs trading?
It is a market-neutral strategy: find two assets whose prices usually move together, go long the one that has fallen behind and short the one that has run ahead when the gap is unusually wide, and close the position when prices converge.
Does pairs trading still work?
In the classic study, profits were much smaller in 1989–2002 than in 1963–1988: about 0.4% against 1.2% a month for the top 20 pairs after a one-day delay. The authors suggest lower transaction costs and more relative-value capital as possible reasons. The test ends in 2002.
How do you pick the pairs in the classic study?
By minimum distance: for each stock over a 12-month formation period, they find the other stock whose normalized price series has the smallest sum of squared differences, then trade the best pairs for the next six months.
Does pairs trading work in crypto?
The classic paper does not test crypto, so it gives no answer. Fees, funding rates, shorting availability and exchange risk all differ from the large US stocks it studied.
Sources
- Pairs Trading: Performance of a Relative-Value Arbitrage Rule. Evan Gatev, William N. Goetzmann and K. Geert Rouwenhorst, Review of Financial Studies 19(3), 797–827 (2006); Yale ICF Working Paper 08-03 (February 2006 version, read in full); NBER WP 7032 (1999), 2006
This article is research, not investment advice. Results on history do not guarantee future results.