
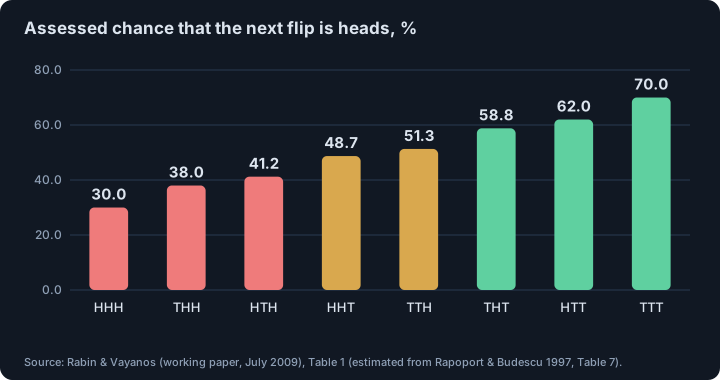
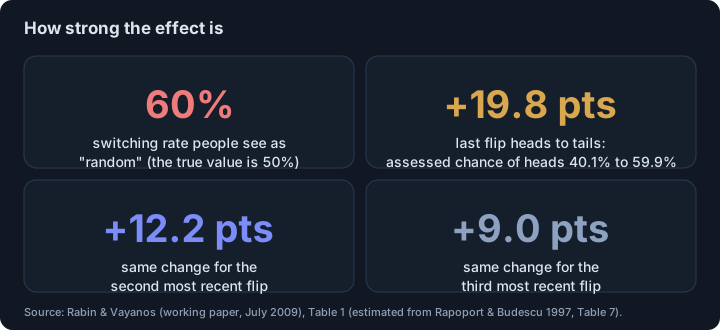
- Short answer: the gambler’s fallacy is the mistaken belief that random sequences should reverse. In coin-flip experiments people treat a switching rate of about 60% as random, and judge heads at only 30% likely after three heads and 70% after three tails; the true chance is 50% each time.
- Rabin and Vayanos (2009 working paper, later in the Review of Economic Studies) show that the same belief can produce the opposite error: someone convinced that luck must reverse underestimates how often streaks occur, over-infers that something has changed, and so predicts that a long streak will continue (a hot-hand fallacy).
- Changing the most recent flip from heads to tails moves the assessed probability of heads from 40.1% to 59.9% (19.8 points); the second most recent flip moves it by 12.2 points, the third by 9.0. Outside the lab, studies of lotteries find people avoid numbers that won recently.
- The evidence is from coin-flip experiments and betting data, not from traders. Applying it to candles is our analogy: whether a market streak will end is a statistical question, not a feeling.
Short answer. The gambler’s fallacy is the belief that a random sequence should reverse: after a streak of heads, tails is “due”. People who hold it treat a switching rate of about 60% as random, although a fair coin switches half the time. Rabin and Vayanos built a model showing that this belief can also produce its opposite: after a long streak, people start predicting that it will continue.1 Traders live inside streaks of candles, wins and losses, so it is worth knowing how the mind misreads them.
What is the gambler’s fallacy?
The paper opens with the standard example: observing flips of a fair coin, people believe a streak of heads makes a tail more likely. It is commonly interpreted as a fallacious belief in the “law of small numbers”, the feeling that a small sample should resemble the population closely.1 The authors review experiments of three kinds: asking people to produce sequences that look random, to recognise random-looking sequences, and to predict the next flip. In all of them the typical subject identifies a switching rate above 50% as random, about 60%.
The paper’s Table 1, estimated from a production-task study, gives the assessed chance of heads after each three-flip history. After heads, heads, heads it is 30.0%; after tails, tails, tails it is 70.0%; after heads, tails, heads it is 41.2%.1 The true chance of heads is 50% every time. The authors also note a shortcoming of the experiments: many only report how many people predict a switch, not their assessed probability, which could be only marginally above 50%.
How strong is the effect in numbers?
Changing the most recent flip from heads to tails raises the assessed probability of heads from 40.1% to 59.9%, an increase of 19.8 points. The second most recent flip matters less (from 43.9% to 56.1%, 12.2 points) and the third less still (45.5% to 54.5%, 9.0 points): the fallacy fades with distance but is not limited to the last flip.1
Does it show up outside the lab?
The paper cites field evidence. In pari-mutuel lotteries, where the winnings on a number are shared among everyone who bet on it, people systematically avoid numbers that won recently. That is a strict mistake, because the numbers with the fewest bets have the largest expected winnings. It also cites evidence from horse and dog races and from casino betting: Croson and Sundali (2005) show that players avoid betting on a colour with many recent occurrences, but also raise their bets after successful prior bets.1
How can one mistake produce two opposite beliefs?
Here is the paper’s central insight. Suppose an investor with the gambler’s fallacy watches a fund manager whose results depend on ability and luck. Convinced that luck should reverse, the investor underestimates how often an average manager will show a streak of good or bad years. After a streak, the investor over-infers that the manager is above or below average and so predicts that the unusual performance continues.1
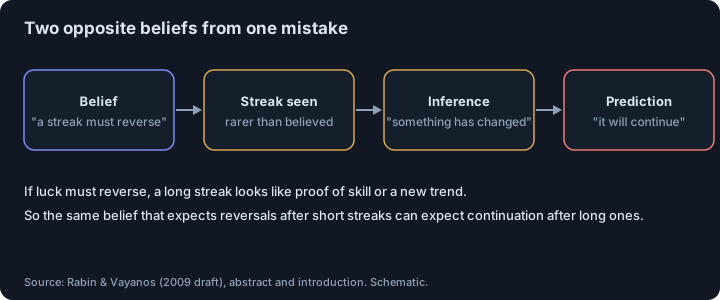
The abstract summarises the model: the individual exaggerates the magnitude of changes in an underlying state but underestimates their duration. When the signals are independent, the individual can predict that long streaks will continue (a hot-hand fallacy); when signals are serially correlated, the individual typically under-reacts to short streaks, over-reacts to longer ones, and under-reacts to very long ones.1 The authors connect the model to finance puzzles such as momentum and reversal in returns and the flows of money into funds.
What a trader can take from this
- A streak is not a debt. Five red candles do not make a green candle more likely by themselves. Whether a bounce is likely depends on how the market behaves after streaks, which you measure; see why most backtests overstate results for how easy it is to fool yourself in that measurement.
- Expect the opposite error too. After a long winning streak, the same mind starts to believe the streak will continue. Winning streaks may say little about skill; how many trades it takes to tell skill from luck gives the numbers.
- Momentum and reversal are empirical questions. Studies of trends across markets are in does trend following work?; the point is that they are tested on data, not on feelings about being overdue.
- Write the rule before the streak. If-then rules cut the room for in-the-moment beliefs; see if-then trading rules. The pull to “win it back” after a losing streak is in revenge trading.
- Do not overread the paper. It models beliefs about random sequences and uses coin-flip data. It does not say traders lose money because of this belief, and it gives no trading rule.
This is educational material, not investment advice.
Footnotes
-
Rabin, M., Vayanos, D., “The Gambler’s and Hot-Hand Fallacies: Theory and Applications”, working paper dated 19 July 2009 (full text of the PDF from Vayanos’s LSE page read); published in the Review of Economic Studies 77(2), 2010, pp. 730–778 (publication details from the journal listing; we did not read the published version, so numbering of tables may differ). Abstract and introduction: the definition, law of small numbers, the fund-manager example, link to finance puzzles. Section 2: experiments of three types, switching rate 60% (stylized fact), Table 1 estimated from Rapoport and Budescu (1997), Table 7 (30.0%, 38.0%, 41.2%, 48.7%, 62.0%, 58.8%, 51.3%, 70.0%; 40.1% to 59.9%; 43.9% to 56.1%; 45.5% to 54.5%), footnote 10 on shortcomings of the experiments and field evidence (Clotfelter and Cook 1993, Terrell 1994, horse and dog races, Croson and Sundali 2005). ↩ ↩2 ↩3 ↩4 ↩5 ↩6 ↩7
Frequently asked questions
What is the gambler’s fallacy?
It is the mistaken belief that random sequences should exhibit systematic reversals, for example that a streak of heads makes a tail more likely next. Rabin and Vayanos link it to a fallacious belief in the law of small numbers: people think even a small sample should resemble the underlying population.
What is the hot-hand fallacy, and how is it related?
The hot-hand fallacy is the belief that a streak will continue, as when basketball fans think a player on a hot streak is more likely to score. The paper shows that a person with the gambler’s fallacy can end up there: convinced luck must reverse, they underestimate how likely a streak is by chance, over-infer that something has changed, and predict that the streak continues.
How strong is the gambler’s fallacy in numbers?
In the paper’s estimate from a coin-sequence experiment (Rapoport and Budescu 1997), the assessed probability of heads is 30% after three heads and 70% after three tails. Changing the most recent flip from heads to tails raises the assessed probability of heads from 40.1% to 59.9%, an increase of 19.8 points. The true probability is 50%.
Does the gambler’s fallacy occur outside the laboratory?
The paper cites studies of pari-mutuel lotteries, where winnings are shared among everyone betting on a number: people avoid numbers that won recently, which is a mistake because those with the fewest bets have the largest expected winnings. It also cites evidence from horse and dog races and from casino betting.
Does a trader need to bet on reversals after a streak?
No evidence in the paper supports that. It studies beliefs about random sequences. Whether returns in a given market have momentum or reversal is an empirical question, answered by data with costs and out-of-sample tests, not by a feeling that a streak is overdue to end.
Sources
- The Gambler’s and Hot-Hand Fallacies: Theory and Applications. Matthew Rabin, Dimitri Vayanos. Working paper dated 19 July 2009 (full text read); published in the Review of Economic Studies 77(2), 2010, pp. 730–778, 2010
This article is research, not investment advice. Results on history do not guarantee future results.