
- Short answer: for a modest real edge (55% wins at 1:1) a typical result clears the usual bar (t = 2) after about 400 trades and the stricter bar (t = 3) after about 900. Thirty trades prove nothing.
- With 30 trades, a measured 55% win rate has a 95% interval of roughly 37% to 73%: it includes both a losing and a very strong strategy.
- The formula is from Lo (2002): the standard error of a Sharpe ratio estimate is about √((1 + SR²/2) / T), where T is the number of observations, under independent returns.
- Harvey, Liu and Zhu (2016) argue that when many ideas have been tried, a new finding should clear a t-ratio above 3.0, not 2.0. If you tested many variants, your bar is the higher one.
Short answer. There is no magic number, but there is a formula. A trading edge of realistic size, such as a 55% win rate with a 1:1 payoff, needs roughly 400 trades before a typical result looks significant by the usual standard, and roughly 900 by the stricter standard that applies when you tried many variants. A sample of 30 or 50 trades is nowhere near enough to tell skill from luck.
How accurate is a win rate measured on 30 or 100 trades?
Not very. A win rate is a measured proportion, and its uncertainty shrinks only with the square root of the number of trades. Assume the measured win rate is 55%. With independent trades, the 95% interval around it is:
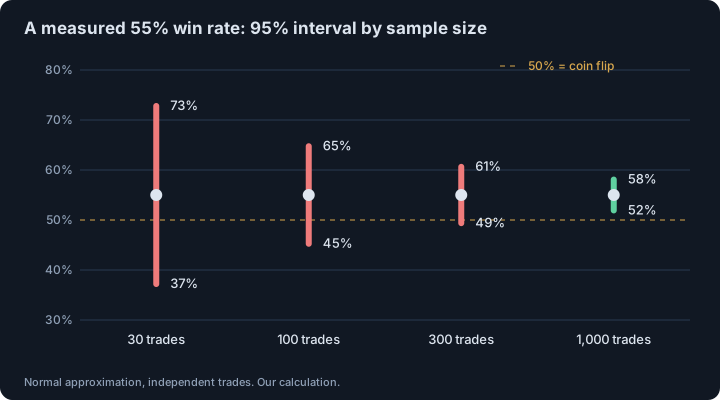
With 30 trades the interval runs from about 37% to 73%: it contains a losing system and an excellent one. With 100 trades it is still 45% to 65%, and it contains 50%, a coin flip. Only around 1,000 trades does the interval stay above 50%.
How many trades does a statistically significant edge need?
Andrew Lo asked the question for investment returns in a paper in the Financial Analysts Journal:
How accurately are Sharpe ratios measured?
Lo, “The Statistics of Sharpe Ratios”, Financial Analysts Journal (2002)
His answer, under independent and identically distributed returns, is that the standard error of an estimated Sharpe ratio over T observations is approximately √((1 + SR²/2) / T).1 For a trader, apply it to results per trade: the per-trade Sharpe ratio is the average result in R divided by its standard deviation. A result is “significant” when the estimate is t standard errors above zero, and solving for T gives the number of trades at which a real edge of that size would typically reach that mark:
T ≈ (1 + S²/2) × t² / S²
For a 1:1 payoff the average result per trade is 2 × win rate − 1, in R. The table uses that (our calculation, independent trades):
| True edge | Average per trade | Trades for t = 2 | Trades for t = 3 |
|---|---|---|---|
| 52% wins, 1:1 | +0.04R | about 2,500 | about 5,600 |
| 55% wins, 1:1 | +0.10R | about 400 | about 900 |
| 60% wins, 1:1 | +0.20R | about 100 | about 220 |
| 40% wins, 2:1 payoff | +0.20R | about 220 | about 490 |
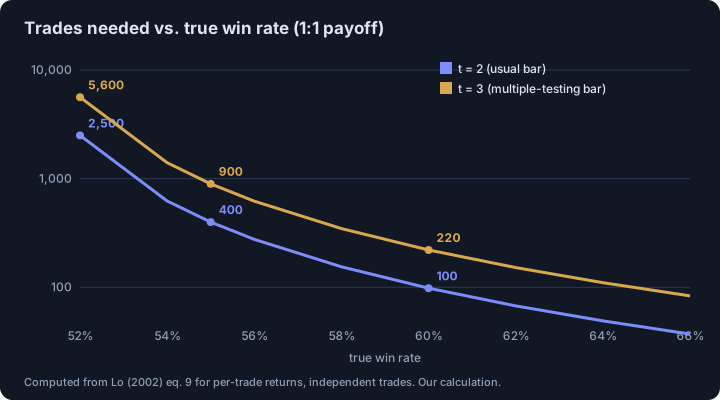
Two readings of the table matter. First, small edges are expensive to prove: moving from a 60% to a 52% win rate multiplies the required sample by about 25. Second, the table shows the point where an edge of that true size typically just clears the bar. To be reasonably sure (about 80% power) you need roughly twice as many trades.
Why is the bar higher if I tried many versions?
Because a 5% false-positive rate means one in twenty random strategies will pass by luck. Harvey, Liu and Zhu looked at hundreds of published return factors and argued that a newly discovered factor “needs to clear a much higher hurdle, with a t-ratio greater than 3.0”.2 The same logic applies to your own testing: if you tried 40 parameter sets and kept the best, you have not done one test, you have done forty. Our article why backtests mislead shows how the number of tries eats a result, and survivorship bias shows what a test silently leaves out.
What breaks the formula?
- Dependent trades. The formula assumes independent results. Lo shows that serial correlation changes the answer a lot: in his example, an annual Sharpe ratio for one hedge fund could be overstated by as much as 65% because of it.1 Several trades taken on the same move are one bet, not several.
- Changing conditions. A sample that mixes a trending year with a ranging year is not a sample of one strategy.
- Costs. Use results after fees and slippage (slippage and price impact); an edge of +0.04R is easily erased.
- Peeking. If you stop the test when it first looks good, the standard errors above no longer apply. Decide the number of trades in advance.
A checklist before you trust a result
- Write the rules before testing and do not change them mid-sample.
- Count every trade the rules produced, including the ones you skipped.
- Compute the average and standard deviation of results in R after costs, then the interval, not just the win rate.
- Count how many variants you tried and raise the bar if the number is large.
- Keep a block of data you never used while designing the rules.
- Size positions by the lower end of your interval, not by the best estimate: see the Kelly criterion.
You can run the numbers on your own trade log in the risk simulator, and the session plan helps you keep a log you can audit.
This is educational material, not investment advice.
Footnotes
-
Lo, A. W., “The Statistics of Sharpe Ratios”, Financial Analysts Journal 58(4), 2002, pp. 36–52 (full text read; equation 9 gives the standard error under IID returns). The 65% figure refers to a hedge fund in his empirical example; Lo’s paper is about Sharpe ratios of fund returns, and applying it to per-trade results is our adaptation. ↩ ↩2
-
Harvey, C. R., Liu, Y., Zhu, H., “… and the Cross-Section of Expected Returns”, Review of Financial Studies 29(1), 2016; quotation from the abstract of the NBER working paper 20592 (2014). The threshold applies to newly published return factors, and we use it here as an analogy for your own repeated testing. ↩
Frequently asked questions
How many trades do I need to know if my strategy works?
It depends on the size of the edge. With 1:1 payoffs, a true 55% win rate needs about 400 trades for a typical result to reach a t-statistic of 2 and about 900 for a t-statistic of 3. A true 60% needs about 100 and 220.
Is 100 trades enough to validate a trading strategy?
Only for a very large edge. With 100 trades, a measured 55% win rate has a 95% interval of about 45% to 65%, which includes a losing strategy.
How many trades are statistically significant?
There is no fixed number. Significance depends on the edge and the spread of your results; the standard error of a per-trade Sharpe ratio is about √((1 + SR²/2) / N), where N is the number of trades.
Why do I need more trades if I tested many strategies?
Because the best of many tries looks good by chance. Harvey, Liu and Zhu argue the bar for a new finding should be a t-ratio above 3.0 instead of 2.0 when many tests have been run.
Sources
- The Statistics of Sharpe Ratios. Andrew W. Lo. Financial Analysts Journal 58(4), 36–52, July/August 2002, 2002
- ... and the Cross-Section of Expected Returns. Campbell R. Harvey, Yan Liu, Heqing Zhu. Review of Financial Studies 29(1), 5–68, 2016 (NBER Working Paper 20592, 2014), 2016
This article is research, not investment advice. Results on history do not guarantee future results.