
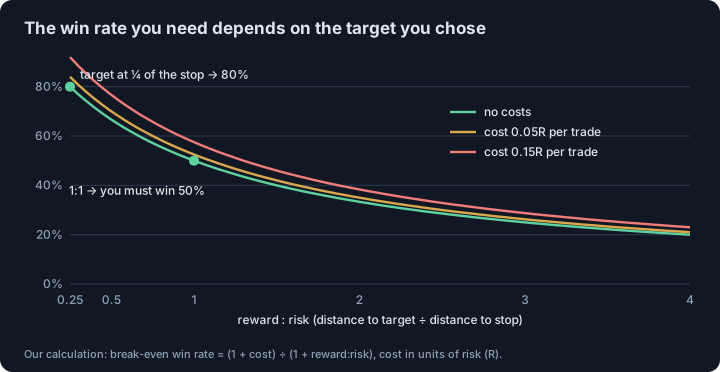
- Short answer: there is no such thing as a free trade. The win rate you need to break even is (1 + costs) ÷ (1 + reward:risk): 50% at 1:1, 40% at 1.5:1, 33% at 2:1, before costs. A setup that “almost always works” has bought its win rate by putting the target close or the stop far.
- On our test with random entries on GER40, gold and Bitcoin candles, a target a quarter of the stop away was hit about 75% of the time and still lost 0.12 to 0.20 R per trade after costs. At 1:1 the win rate was 49%, as the maths says.
- Researchers describe the same shape elsewhere: selling rarely-paying options can beat a portfolio “often” by almost any measure (Goetzmann, Ingersoll, Spiegel, Welch), and carry trades go “up by the stairs and down by the elevator” (Brunnermeier, Nagel, Pedersen).
- The honest way to test a “free trades” idea is to fix the stop and target before the trade, log every one, and compare the win rate with the break-even rate. With 30 trades, an 80% win rate is consistent with anything from 63% to 90%.
Short answer. There are no free trades. When someone says a setup is so obvious that you can close it with your eyes shut at 1:1 or 1.5:1, one of three things is going on: the target sits close and the stop far, so the win rate is bought with geometry; the sample is small or filtered by memory; or the large loss exists and has not happened yet. The win rate you need to break even is fixed by arithmetic, and no setup escapes it.
If you heard a trader say that after a drawdown on a funded account they switched to “free money” trades, it is worth separating two things. Cutting size after a loss is sensible. Searching for trades that cannot lose is not a strategy, because the market does not issue them.
What win rate do I need to break even?
Expectancy per trade, in units of risk (R), is the win rate times the reward, minus the loss rate, minus costs. Set it to zero and the break-even win rate is (1 + cost) ÷ (1 + reward:risk). At 1:1 it is 50%; at 1.5:1 it is 40%; at 2:1 it is 33%. Add a cost of 0.1 R per trade (spread, commission and slippage as a fraction of the stop) and those become 55%, 44% and 37%. That is our calculation from the formula, not a finding from a study.
So “I win 70% of my 1:1 trades” is only impressive if it is measured over enough trades and the stop and target were fixed in advance. The next sections explain why those two conditions are so often missing.
How much win rate can I buy with a closer target?
For a random walk, the chance of reaching a target before a stop is the stop distance divided by the sum of both distances, so the win rate falls from 80% to 20% as the target moves from a quarter of the stop to four stops away. We checked it on real candles: GER40 at 5 minutes, gold at 1 hour and Bitcoin at 1 hour, 2022–2026, with random entries and random direction, a stop of 1 ATR and a target at various distances.
| Target distance (stops) | GER40 5m win / net R | Gold 1h win / net R | Bitcoin 1h win / net R |
|---|---|---|---|
| ¼ | 74.5% / −0.18 | 74.6% / −0.12 | 75.5% / −0.20 |
| 1 | 49.4% / −0.13 | 49.3% / −0.06 | 49.3% / −0.16 |
| 3 | 25.6% / −0.09 | 25.8% / −0.02 | 24.2% / −0.17 |
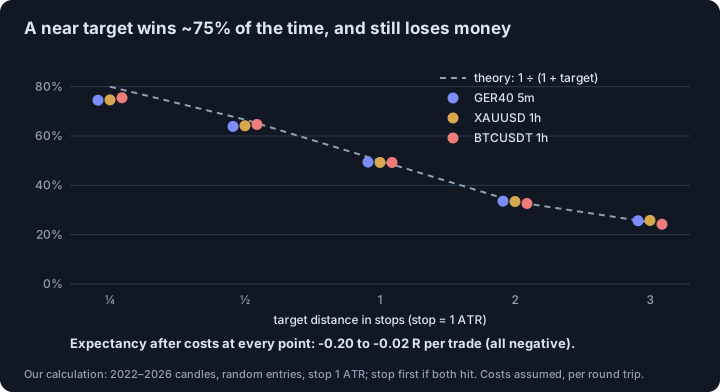
The win rate matched the geometry within a few points everywhere, and the expectancy after costs was negative at every distance, between −0.02 and −0.20 R. Before costs it ranged from −0.07 to +0.03 R, which is zero within noise; the slightly low win rates at near targets come from our rule that a candle touching both stop and target counts as a stop. The point is not that markets cannot be beaten. It is that a 75% win rate on its own is cheap to produce and tells you nothing about skill. Costs are assumptions (0.006%, 0.012% and 0.08% per round trip), and they weigh more when the stop is tight, which is why near targets with tight stops fare worst.
Isn’t moving the stop to break-even a free trade?
In trader slang, a “free trade” is one where the stop has been moved to the entry price, so it can no longer lose. We tested it on the same random entries: stop 1 ATR, target 1 ATR, and the stop moved to the entry once price went 0.5 ATR in favour. Results across the three instruments: about 34–37% wins, 35–36% losses and 28–30% break-even exits, with expectancy before costs between −0.01 and +0.01 R, the same as without the move. The rule changes how the results look, turning a third of the trades into zeros and lowering the loss rate, and it changes nothing about the average.
That is not an argument against break-even stops, which may suit your psychology or your risk limits. It is an argument against the idea that they create an edge.
What do researchers say about high-win-rate profiles?
The shape of “win often, lose big rarely” is well studied under other names. Goetzmann, Ingersoll, Spiegel and Welch, in a paper about gaming performance measures, give a simple example: a portfolio that sells rarely-paying derivatives, such as deep out-of-the-money options, is better than a near-identical portfolio whenever the rare event does not happen, so it looks better by almost any measure. They conclude that “any portfolio, even an ex ante optimal one, can be beaten often.”1 A high hit rate is easy to manufacture and proves nothing about the quality of a strategy.
Brunnermeier, Nagel and Pedersen found the same shape in currencies. Carry trades, which collect an interest-rate difference, show negative skewness: high interest-rate differentials predict crash risk. The paper links this to the trader saying that exchange rates go “up by the stairs and down by the elevator.”2 A strategy that collects small, frequent gains and gives them back in a few sharp drops looks the same on a trade log: many winners and a tail.
Why does the “free trade” profile feel so good on a prop challenge?
Because in some setups it passes more often. We simulated a challenge with a 10% target and a 10% loss limit from the starting balance, 1 R equal to 1% of the account, up to 300 trades and a cost of 0.05 R per trade. A strategy that wins 50% at 1:1 (expectancy −0.05 R) passed 25% of the time and breached the limit 72% of the time. A strategy that wins 90% of trades at +1 R and loses 10% at −9 R (also −0.05 R after costs) passed 53% of the time, with a median of 10 trades. Ten quick wins hit the target before the first big loss, and one 9 R loss does not on its own breach a 10% limit.
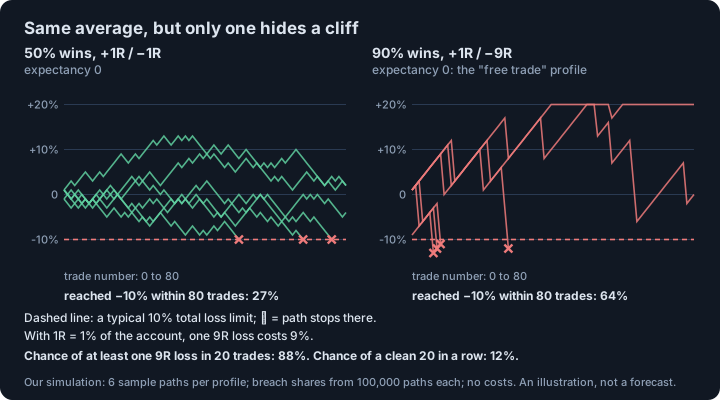
The catch is everything after. Many firms also apply a daily loss limit; 5% is a figure commonly seen, and rules differ by firm, so check yours. Under a 5% rule, a single −9 R loss at 1% risk ends the attempt on its own, so passing requires ten wins in a row: 0.9 to the power of 10, about 35%. On a live account, the chance of at least one 9 R loss in 20 trades is 88% (1 − 0.9²⁰). The profile is at its best in the one phase where a fast pass pays and at its worst afterwards. How the rules shape risk-taking is covered in prop firm drawdown rules and how evaluations change risk-taking.
What should I do after a drawdown instead?
Coval and Shumway studied proprietary traders at the Chicago Board of Trade and report that traders appear highly loss-averse and regularly take above-average risk in the afternoon to recover morning losses.3 We only read the abstract, and it concerns proprietary traders at an exchange, not funded-account traders, but the pattern is the one to avoid: responding to a loss by changing the risk profile of the book. A sturdier response is the opposite one:
- Cut size, not rules. Lower variance with smaller position size, which helps whatever the strategy. The reasoning is in Kelly criterion and position sizing.
- Do not change the payoff to raise the win rate. Moving the target closer buys a number, not an edge, as the figures above show.
- Fix stop and target before you enter. Then the sample cannot be filtered by memory; the pull to cut winners early is covered in why traders cut winners early and hold losers.
- Log every trade, including the “obvious” ones you skipped. A setup that is obvious only after it worked is hindsight.
- Compare to the break-even rate, with an interval. A measured 80% over 30 trades has a 95% interval of roughly 63% to 90%; over 100 trades about 71% to 87% (Wilson interval, our calculation). How many trades you need is in how many trades to validate a strategy.
- Watch the largest loss against the average win. If one loss equals ten wins, the profile is the one in the figure above.
What this article does not show
We did not find evidence that “free” trades exist, and we did not prove that none can exist: a real edge is possible, and it shows up as a win rate above the break-even rate for its payoff over a large, honestly logged sample. Our test used random entries to show the geometry; it says nothing about any specific setup. The passing-rate simulation depends on its assumptions (1% risk, 300 trades, costs of 0.05 R) and on firm rules that differ from firm to firm. We did not hear the podcast the question came from and make no claim about what its guest did.
This is educational material, not investment advice.
Related. Prop firm drawdown rules · How evaluations change risk-taking · Kelly criterion · Why traders cut winners early · How many trades to validate a strategy · Do day traders make money?
Footnotes
-
Goetzmann, W., Ingersoll, J., Spiegel, M., Welch, I., “Portfolio Performance Manipulation and Manipulation-Proof Performance Measures”, working paper dated 15 March 2006 (full text from Yale’s repository read); published in The Review of Financial Studies 20(5), 2007, pp. 1503–1546 (we did not read the journal version, so page and footnote numbers may differ). The quoted sentence is from footnote 10 of the working paper, where the authors compare two near-identical portfolios, the second selling derivatives with a rare payoff such as deep out-of-the-money options. ↩
-
Brunnermeier, M., Nagel, S., Pedersen, L., “Carry Trades and Currency Crashes”, NBER Working Paper 14473, November 2008 (full text read); published in NBER Macroeconomics Annual 2008, vol. 23, 2009, pp. 313–347. The authors say their finding that high interest-rate differentials predict negative skewness “is consistent with the saying among traders” quoted in the text; they note the saying holds for investment currencies and the reverse for funding currencies. ↩
-
Coval, J., Shumway, T., “Do Behavioral Biases Affect Prices?”, The Journal of Finance 60(1), 2005, pp. 1–34, DOI 10.1111/j.1540-6261.2005.00723.x. We read the abstract (bibliographic page); we did not read the full text, so numbers from the paper are not used. Our own calculations in this article: the break-even formula, the random-entry test on GER40 5-minute (2022–2026), XAUUSD 1-hour and BTCUSDT 1-hour candles with stated cost assumptions, the challenge simulation (100,000 attempts per profile) and the Wilson intervals; they are illustrations, not results from the cited papers. ↩
Frequently asked questions
What is a “free trade” in trading?
Traders use the phrase for two things: a trade whose stop was moved to break-even, so it cannot lose, and a setup that seems to win almost every time. Neither is free. A break-even stop turns some losers into zero-result trades but, in our test on random entries, left the expectancy unchanged, and a very high win rate is usually bought with a close target or a distant stop.
What win rate do I need to break even at 1:1?
50% before costs. The break-even win rate is (1 + cost) ÷ (1 + reward:risk), with cost in units of risk. At 1:1 with a cost of 0.1 R per trade you need 55%; at 1.5:1 you need 44%; at 2:1 you need 37%.
Why do high win rate strategies blow up?
Because the profile is many small wins and rare large losses. The average can be zero or positive, but a single large loss wipes out many wins and, with account loss limits, can end the account. Goetzmann and colleagues note that selling derivatives with a rare payoff makes a portfolio look better “by almost any performance measure” until the rare event arrives.
Is a 90% win rate with 1:9 risk-reward good?
It is a coin flip in disguise. Winning 90% of trades at +1 R and losing 10% at −9 R has zero expectancy before costs, and costs make it negative. In our simulation it passed a 10% target and 10% loss limit more often than a 50% strategy at 1:1, but with a 5% daily limit a single 9 R loss at 1% risk ends the attempt.
How many trades do I need to trust my win rate?
More than most people log. A measured 80% win rate over 30 trades has a 95% interval of about 63% to 90%; over 100 trades it narrows to about 71% to 87%. Compare the interval with the break-even rate for your payoff, not with 50%.
Sources
- Portfolio Performance Manipulation and Manipulation-Proof Performance Measures. William Goetzmann, Jonathan Ingersoll, Matthew Spiegel, Ivo Welch. Working paper dated 15 March 2006 (full text read); published in The Review of Financial Studies 20(5), 2007, pp. 1503–1546, 2007
- Carry Trades and Currency Crashes. Markus Brunnermeier, Stefan Nagel, Lasse Pedersen. NBER Working Paper 14473, November 2008 (full text read); NBER Macroeconomics Annual 2008, vol. 23, 2009, 2008
- Do Behavioral Biases Affect Prices?. Joshua Coval, Tyler Shumway. The Journal of Finance 60(1), 2005, pp. 1–34 (abstract only), 2005
This article is research, not investment advice. Results on history do not guarantee future results.