
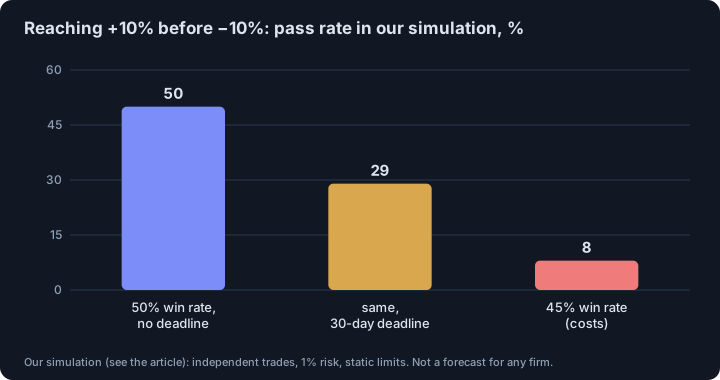
- With a 50% win rate, 1:1 payoff and no deadline, reaching +10% before −10% is a fair coin: 50%. A 30-day deadline in our model cuts that to 29% (1% risk per trade).
- Costs matter more than they look: a 45% win rate (our stand-in for fees and spreads on a coin-flip strategy) cuts the pass rate to 8% and the total-loss failure to 63%.
- Magdon-Ismail et al. (2004): for a random walk with zero drift the expected maximum drawdown grows like a square root of time; with negative drift it grows linearly. Costs make drift negative.
- The numbers are from our own simulation with stated assumptions (independent trades, static limits). They are not a forecast for any firm.
A challenge with a profit target, a maximum loss and a daily loss limit is a probability problem before it is a trading problem. You can estimate your odds before spending the fee.
The textbook case: a fair coin
Take a trader with no edge: each trade wins or loses the same amount with probability one half. Classic gambler’s-ruin math says the chance of reaching +10% before −10% is exactly 10 / (10 + 10) = 50%, whatever the size of each bet. That is the best case for a trader with zero edge: it needs no deadline, no costs and no daily limit.
Real rules take that 50% away piece by piece. We simulated 100,000 attempts of each case with these assumptions of ours: target +10%, total loss −10% of the starting balance, daily loss limit −5% of the day’s start, 30 days, 3 trades per day, independent trades, no spread or slippage except where a lower win rate stands in for them. Different firms’ rules differ.
Results (our simulation)
| Risk per trade | Strategy | Pass | Total loss | Daily limit | Time out |
|---|---|---|---|---|---|
| 0.5% | 50% wins, 1:1 | 3.6% | 3.5% | 0% | 93% |
| 1% | 50% wins, 1:1 | 29% | 29% | 0% | 42% |
| 1% | 45% wins, 1:1 (costs) | 8% | 63% | 0% | 29% |
| 1% | 55% wins, 1:1 (edge) | 63% | 8% | 0% | 29% |
| 2% | 50% wins, 1:1 | 34% | 9% | 57% | 0% |
| 2% | 55% wins, 1:1 | 52% | 5% | 43% | 0% |
| 3% | 50% wins, 1:1 | 28% | 4% | 68% | 0% |
What the table says:
- A deadline turns a fair game into a hard one. At 0.5% risk the trader mostly times out. At 1% the no-deadline 50% falls to 29%.
- Costs turn it against you. A small drop in win rate (45% instead of 50%) moves most outcomes to the total-loss column. That is why fees, spread and slippage — see slippage and price impact — matter more than strategy tweaks.
- Bigger size is not a free lunch. At 2% risk the pass rate rises, but the daily limit ends 57% of attempts. The rules reward variance, which is the incentive in why prop rules push risk-taking.
- An edge helps a lot. A 55% win rate at 1% passes 63% of the time — but real edges of that size are rare; we did not find one in our own research on patterns. Do not infer that you have one.
Why drawdown limits eventually bite
Magdon-Ismail, Atiya, Pratap and Abu-Mostafa studied the maximum drawdown, “the largest drop from a peak to a trough”, of a Brownian motion with drift. They derived its distribution and found that as time grows, the expected maximum drawdown grows logarithmically for positive drift, as a square root for zero drift and linearly for negative drift.1
Read for a trader: with a positive edge, drawdowns grow slowly; with no edge they grow with the square root of time; with costs that make the average trade negative, they grow in a straight line, so a fixed floor is eventually hit. This is a continuous-time model, and real trades are neither continuous nor independent, so use it for the shape, not the numbers.
And the funded stage?
Passing is a one-time event. The funded stage has the same floors and no end date, so if the expected value per trade is zero or negative, the floor is hit eventually. The FSMA also notes that the profit share in the funded stage is the firm’s to define.2 Our simulation does not model it.
Using this yourself
- Estimate your win rate and payoff after costs, from a real record, before paying.
- Simulate your own rules in the risk simulator and look at the daily-limit column, not just the pass rate.
- Test whether your numbers are real: why backtests lie, and how large to bet: the Kelly criterion.
Educational material, not investment advice.
Footnotes
-
Magdon-Ismail, M., Atiya, A. F., Pratap, A., Abu-Mostafa, Y. S., “On the Maximum Drawdown of a Brownian Motion”, Journal of Applied Probability 41(1), 2004, pp. 147–161, DOI 10.1239/jap/1077134674. We read the bibliographic page and a summary of the abstract; the quoted phrase “the largest drop from a peak to a trough” is the paper’s definition of the maximum drawdown as given there. We did not re-derive the results. ↩
-
FSMA warning of 7 March 2024, see how challenges earn money. ↩
Sources
- On the Maximum Drawdown of a Brownian Motion. Malik Magdon-Ismail, Amir F. Atiya, Amrit Pratap, Yaser S. Abu-Mostafa. Journal of Applied Probability 41(1), 147–161, March 2004, 2004
- The FSMA warns consumers against shadow investment game. Financial Services and Markets Authority (Belgium), 7 March 2024, 2024
This article is research, not investment advice. Results on history do not guarantee future results.