
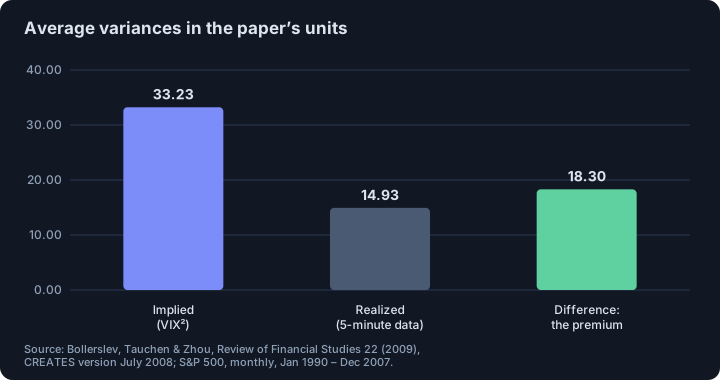
- Short answer: because option buyers pay for protection against variance, and sellers demand compensation for bearing it. In Bollerslev, Tauchen and Zhou (2009), average implied variance (VIX squared) was 33.23 against 14.93 realized, a variance risk premium of 18.30, about 2.2 times in variance, about 1.5 times in volatility.
- The premium carried information about future returns: it explained 6.82% of the variation in next-quarter S&P 500 returns (t = 2.86) and only about 1% at one month, in 1990–2007 data.
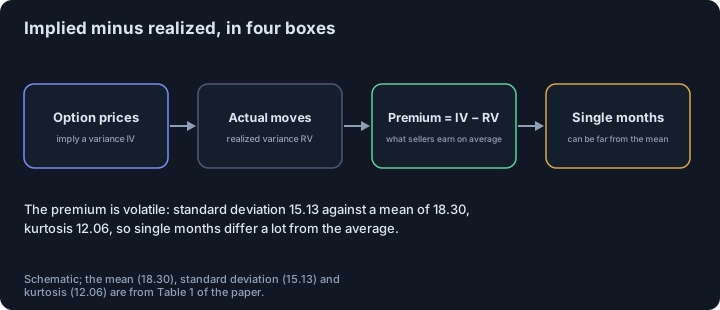
- It is an average, not a guarantee: the monthly premium has a standard deviation (15.13) close to its mean (18.30) and kurtosis of 12, so single months can be far from the average, and the paper does not report a seller’s profit and loss.
- The evidence is for US equities. The paper does not test crypto options, and we do not claim that the same premium or the same predictive power exists there.
Short answer. Implied volatility is the market’s price for protection against future movement, and realized volatility is what actually happened. On average, over 1990–2007 in the S&P 500, the price was much higher than the outcome: implied variance averaged about 2.2 times realized variance. The gap, called the variance risk premium, is the compensation that option sellers earn on average for bearing variance risk.1
What are implied and realized variance?
Implied variance is the variance that option prices imply for the coming month. Bollerslev, Tauchen and Zhou use a “model-free” version computed from a whole range of option prices without relying on the Black–Scholes formula, which is essentially the VIX squared.1 Realized variance is measured afterward from intraday data: the sum of squared five-minute returns.1 The variance risk premium is the difference between the two: implied minus realized.
How big was the gap?
For monthly data from January 1990 to December 2007, the paper’s Table 1 reports average implied variance 33.23, average realized variance 14.93 and an average variance risk premium of 18.30, all in the paper’s units. The ratio does not depend on units: implied variance was about 2.2 times realized variance on average, which is about 1.5 times in volatility terms (the square root).12
The premium is not smooth. Its standard deviation is 15.13 (against a mean of 18.30), its skewness is 2.14 and its kurtosis is 12.06: single months can be far from the average.1 Contemporaneous correlations of monthly S&P 500 returns with the variance measures range from −0.34 to −0.23: when variance is high, returns are lower.1
Did the gap predict returns?
Yes, in this sample and at one horizon in particular. The authors regress future S&P 500 excess returns on the premium. At one month the R² is just above 1%; at one quarter it is 6.82% with a t-statistic of 2.86; beyond six months it tapers off. They report that at the quarterly horizon it beats the P/E ratio, the default spread and the consumption-wealth ratio as a predictor. High premiums are followed by high returns, low premiums by low returns.1
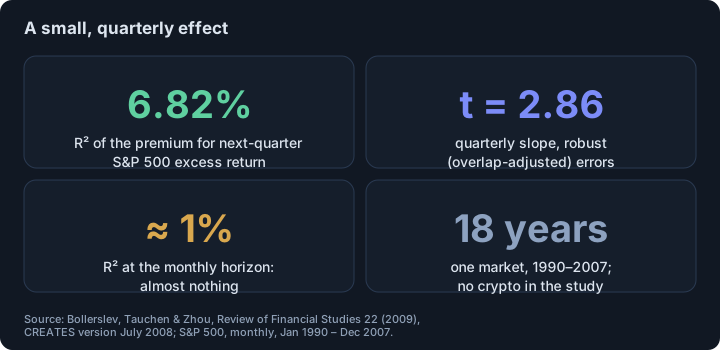
Two warnings follow from the paper itself. First, the authors say their results depend crucially on using model-free implied variance and high-frequency realized variance, as opposed to Black–Scholes implied volatilities and daily realized variance.1 Second, the paper notes that R² values from overlapping multi-period regressions need to be read with care, since they grow mechanically with the horizon.1 The sample is eighteen years of one index.
Is selling options “free money” then?
No. A positive average premium is what the authors’ model treats as compensation for bearing risk, linked to the volatility of consumption-growth volatility.1 The paper reports averages: it does not show a seller’s profit and loss, its worst months or its drawdowns. Any short-volatility position has to be sized for the months when realized volatility rises above implied, a risk the average hides; see Kelly sizing and the maximum drawdown rules of prop firms.
What does this mean for crypto options?
The paper covers the S&P 500 only. For Bitcoin and Ether options the same questions can be asked: is implied volatility above realized on average, and does the gap predict anything? We have not tested them and the paper gives no answer. What carries over without any test is arithmetic: if implied volatility sits above your expected realized volatility, a long option starts at a disadvantage; if you sell, you collect it and you are exposed to the fat tail. For how fat Bitcoin’s tails are in our data, see Bitcoin’s fat tails and volatility clustering.
What should a trader take from this?
- Compare the implied-volatility index with your own realized-volatility measure, using the same time unit and the same type of return, before reading a gap as “cheap” or “expensive”.
- Remember that the gap was positive on average, not necessarily in each month; size positions for the bad month.
- Do not use the premium as a timing signal for crypto without testing it there: the evidence here is US equities in 1990–2007.
- Measure realized volatility the way the paper does, from intraday returns, for a better estimate; see forecasting tomorrow’s volatility.
This is educational material, not investment advice.
Related. Bitcoin’s fat tails and volatility clustering, forecasting tomorrow’s volatility.
Footnotes
-
Tim Bollerslev, George Tauchen and Hao Zhou, “Expected Stock Returns and Variance Risk Premia”, Review of Financial Studies 22(11), 4463–4492 (2009); we read the CREATES Research Paper 2008-48 version of July 2008 (abstract, introduction, sections 3–4, Table 1 and the quarterly result). Monthly data January 1990 – December 2007; implied variance is the VIX squared, realized variance is computed from 5-minute returns. The units of the variance figures are those of the paper (annualized percentage form); the journal text may differ in details. ↩ ↩2 ↩3 ↩4 ↩5 ↩6 ↩7 ↩8 ↩9 ↩10
-
Our arithmetic from Table 1: 33.23 ÷ 14.93 = 2.23 for variance, √2.23 = 1.49 for volatility. ↩
Frequently asked questions
Why is implied volatility higher than realized volatility on average?
Because it includes a premium: investors pay extra for options that protect against sudden increases in variance. In S&P 500 data for 1990–2007, average implied variance was 33.23 against 14.93 for realized variance in the paper’s units.
What is the variance risk premium?
It is implied variance minus realized variance. The authors measure implied variance with the VIX squared and realized variance from five-minute returns, and show the gap is positive on average.
Does the variance risk premium predict stock returns?
In the 1990–2007 sample it did at the quarterly horizon: R² of 6.82% with a t-statistic of 2.86, higher than the P/E ratio, the default spread or the consumption-wealth ratio. At one month the R² was only about 1%.
Does it mean selling options always makes money?
No. The premium is positive on average, but it is volatile (standard deviation 15.13 against a mean of 18.30, kurtosis 12.06 in the paper), so single months can be far from the average. The paper reports averages, not a seller’s profit and loss or drawdowns.
Sources
- Expected Stock Returns and Variance Risk Premia. Tim Bollerslev, George Tauchen and Hao Zhou, Review of Financial Studies 22(11), 4463–4492 (2009); CREATES Research Paper 2008-48 (July 2008 version, read), 2009
This article is research, not investment advice. Results on history do not guarantee future results.