
- Short answer: UST had no off-chain collateral. It was held at USD 1 by a swap rule: 1 UST could always be exchanged for USD 1 of LUNA. When many holders swapped at once, UST supply fell but LUNA supply exploded, LUNA’s price collapsed, and the backing for the remaining UST disappeared.
- An NBER paper using Terra blockchain data (Liu, Makarov, Schoar) dates the run: two large addresses withdrew 375 million UST from Anchor on 7 May 2022; late on 9 May LUNA’s market cap fell to the UST supply and UST dropped to USD 0.75; by the end of 13 May UST was below USD 0.20.
- Between 7 and 13 May users swapped 7.42 billion UST (worth USD 4.65 billion) into LUNA, and LUNA’s supply rose from under 1 billion to 5.89 trillion tokens.
- Large, sophisticated holders left first and lost less: addresses above 10 million UST lost 26% on average, those below 1,000 UST lost 76%. Some small holders added money during the run, trying to “buy the dip”.
Short answer. UST was a stablecoin with no dollars behind it. It stayed at USD 1 because of a rule: one UST could always be swapped for USD 1 worth of LUNA, Terra’s own token. That works while few people use it. When many holders swap at once, UST supply shrinks but the LUNA supply explodes, LUNA falls, and the thing that was supposed to back UST loses its value. This is the “death spiral” that an NBER paper documented, using Terra blockchain data, for the crash of May 2022.1
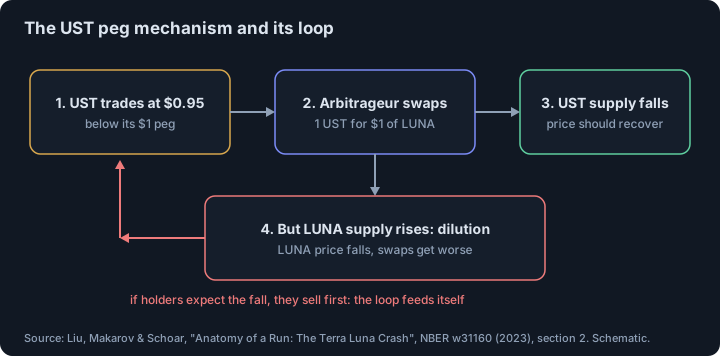
How was UST supposed to hold USD 1?
The paper explains that, unlike Tether or Circle, which are backed by off-chain liquid assets, UST “was not supported by off-chain collateral but by a smart contract” that allowed the exchange of one unit of UST for USD 1 worth of LUNA, and the reverse.1 The peg depended on arbitrage. If UST traded below USD 1, a trader could buy it, convert it into USD 1 worth of LUNA, and profit. That reduces UST supply and pushes its price back up.
The authors describe UST in economic terms as “infinite maturity convertible debt with a face value of $1 backed by LUNA”.1 The danger is in the word backed. A claim on LUNA is only as good as LUNA’s price, and the claim itself is what creates new LUNA.
Why does swapping create a death spiral?
Each UST swapped into LUNA reduces the UST supply but increases the LUNA supply, which dilutes existing LUNA holders. The paper’s reasoning: if a big increase in LUNA supply is expected to push LUNA’s price down, any LUNA holder is better off selling before the conversion. This is the “death spiral of both UST and LUNA falling in tandem”.1
It is not automatic. The authors note that if investors were fully rational and understood UST as a claim on LUNA’s value, conversions would already be priced in. But for LUNA to back UST there must be enough value in the whole system, so instability grows with the amount of UST outstanding.1 That amount had grown a lot.
Why was the system fragile before the run?
UST was pushed into use by a lending protocol, Anchor, where holders could deposit UST at a stable 19.5% yield. The paper finds that both lending and borrowing rates were heavily subsidised: by April 2022 the daily subsidy had reached USD 6 million, and the community voted to lower the rate gradually starting 1 May 2022.1 UST supply reached 18.5 billion by the crash; right before it, Anchor held about 12 billion UST and the community account another 3 billion.1
Other signs were building up. LUNA peaked at USD 119.18 on 5 April 2022 and then fell along with the market, and in the second half of April the entry rate into Anchor dropped while the exit rate rose.1 The authors do not say the run was inevitable, only that the system “was becoming increasingly fragile”.
How did the run unfold, day by day?
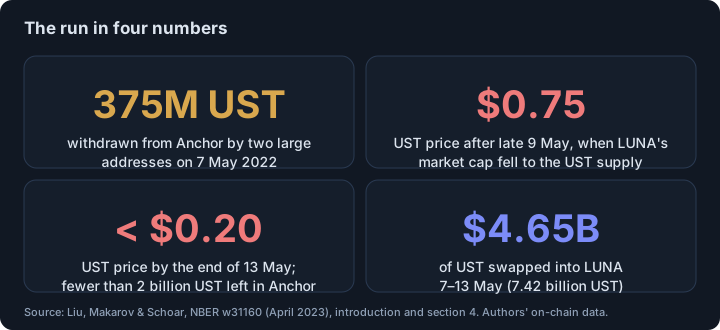
According to the paper:1
- 7 May 2022: two large addresses withdrew 375 million UST from Anchor. UST began to slip and other withdrawals followed.
- 7–9 May: the Terraform Labs team and the Luna Foundation Guard (LFG) tried to defend the peg. The LFG audit cited in the paper puts the total spent on buying UST and LUNA at about USD 2.5 billion (80,071 BTC plus about 26.3 million USDT and 23.6 million USDC).
- Late 9 May: withdrawals accelerated at the point where LUNA’s market capitalisation became equal to the outstanding UST supply. UST fell to USD 0.75.
- 7–13 May: users swapped 7.42 billion UST, worth USD 4.65 billion. From 11 to 13 May the LUNA supply grew from under 1 billion to 5.89 trillion tokens, while its price dropped from about USD 50 to almost nothing.
- End of 13 May: fewer than 2 billion UST remained in Anchor and UST was below USD 0.20.
The same paper looks at an earlier de-pegging in May 2021 and argues that it survived because UST supply was much smaller, so the team could act as lender of last resort. In 2022 the supply was far larger than the funds available to defend the peg, and traders knew it.1
Who got out, and who lost the most?
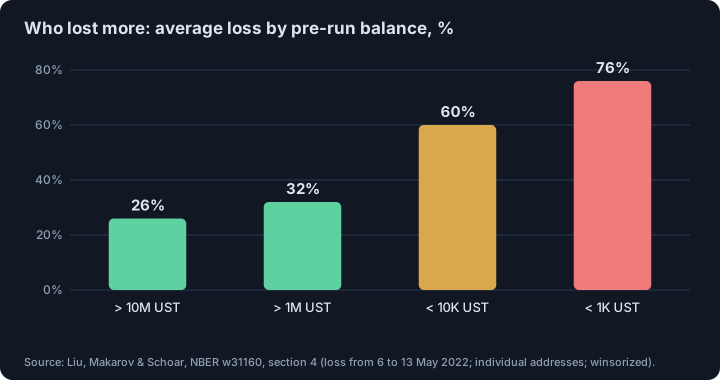
The authors classify individual addresses by their balance on Anchor before the run and by how sophisticated their past on-chain behaviour was (use of several exchanges, use of bridges, trading volume relative to balance). The result: addresses above 10 million UST had withdrawn almost 100% of their balance by the end of 12 May, while addresses with 1,000–10,000 UST still had about half left on Anchor. Average losses fell with size: 26% above 10 million UST, 32% above 1 million, 60% below 10,000 and 76% below 1,000.1
Several small addresses even bought UST on 9 or 10 May, when it briefly looked as though the price was stabilising below USD 1, an attempt to “buy the dip”. They fared particularly badly.1 Public blockchain data did not create a level playing field: transparency helped those who could read it fast.
Was it a manipulation attack?
The authors conclude it was “unlikely due to concentrated market manipulation by a third party”, and that it was precipitated by growing concerns about sustainability; once a few large holders changed positions on 7 May, others followed, and the visibility of on-chain transactions amplified the speed of the run.1 This is the authors’ reading of the data. The paper is a working paper (April 2023); the NBER page states it was later published in the Journal of Financial Economics in 2026, and we cite the working-paper numbers.
What a trader can take from this
- A peg is a promise, not a price. Ask what stands behind one unit: off-chain assets, other crypto, or a token whose value depends on the stablecoin itself.
- A subsidised yield has a bill. The paper’s Anchor numbers show how a 19.5% rate required a growing daily subsidy.
- Watch the ratio. The paper marks the moment LUNA’s market cap fell to the UST supply as the point of acceleration. A backing asset worth less than the claims on it is a warning.
- “Buy the dip” on a broken peg is not a dip. The smallest addresses that bought during the run lost the most.
Related. How prices of a stablecoin relate to Bitcoin is covered in Tether and Bitcoin prices: what the research found. A cascade where the winners are closed to cover a loss is explained in auto-deleveraging (ADL), and why gaps between prices persist in why crypto arbitrage gaps persist.
This is educational material, not investment advice.
Footnotes
-
Liu, J., Makarov, I., Schoar, A., “Anatomy of a Run: The Terra Luna Crash”, NBER Working Paper 31160, April 2023 (full text of the PDF read). Abstract and introduction: USD 50 billion, three days, conclusions on manipulation and on large versus small holders; section 2: swap mechanism and “infinite maturity convertible debt”, death spiral reasoning; introduction and section 3: Anchor 19.5% yield, USD 6 million daily subsidy, vote to reduce from 1 May 2022, UST supply 18.5 billion, Anchor about 12 billion, LUNA peak USD 119.18 on 5 April 2022; section 4: 375 million UST withdrawn on 7 May, USD 0.75 late on 9 May, below USD 0.20 and under 2 billion UST in Anchor on 13 May, about USD 2.5 billion spent by Terraform Labs and LFG, 7.42 billion UST (USD 4.65 billion) swapped 7–13 May, LUNA supply under 1 billion to 5.89 trillion on 11–13 May, withdrawals and losses by balance size; section 5: the May 2021 de-pegging. The NBER page lists publication in the Journal of Financial Economics, vol. 184 (2026); we did not read the journal version. ↩ ↩2 ↩3 ↩4 ↩5 ↩6 ↩7 ↩8 ↩9 ↩10 ↩11 ↩12 ↩13
Frequently asked questions
Why did UST lose its peg to the dollar?
UST was not backed by off-chain assets such as treasuries. A smart contract let anyone swap 1 UST for USD 1 worth of LUNA. In May 2022 growing doubts about the system, starting with large withdrawals from the Anchor lending protocol, led holders to swap UST for LUNA in size. The swaps flooded the market with LUNA, its price collapsed, and the value backing UST vanished.
What is a death spiral in a stablecoin?
It is a loop in which the fall of the backing token drives selling of the stablecoin, and the redemption of the stablecoin creates more of the backing token, pushing its price down again. The NBER paper describes it: swapping UST for LUNA dilutes LUNA holders, so holders sell LUNA ahead of the swaps, and UST and LUNA fall together.
How fast did the Terra collapse happen?
According to the NBER paper, within three days in May 2022 about USD 50 billion of value was wiped out. The first signs were on 7 May 2022; late on 9 May UST fell to USD 0.75, and by the end of 13 May it was below USD 0.20.
Who lost the most in the UST run?
Smaller and less sophisticated holders. The paper measured losses by each address’s balance before the run: 26% on average for addresses above 10 million UST, 32% above 1 million, 60% below 10,000 and 76% below 1,000.
Was the Terra collapse caused by a single attacker?
The authors conclude that it was unlikely to be due to concentrated market manipulation by a third party, and was instead precipitated by growing concerns about the sustainability of the system. This is their analysis of on-chain and exchange data, not a legal finding.
Sources
- Anatomy of a Run: The Terra Luna Crash. Jiageng Liu, Igor Makarov, Antoinette Schoar. NBER Working Paper 31160, April 2023 (full text read); published in the Journal of Financial Economics, vol. 184 (2026), according to the NBER page, 2023
This article is research, not investment advice. Results on history do not guarantee future results.