
- Short answer: in one pre-registered study, yes, in the first 25 minutes after the open: +50.9 points net per trade (about $1,000 per contract) on 18 out-of-sample trades, 61% winners, t = 2.49. The author himself calls it “promising but not proven”.
- The rule: an overnight drop of at least 2 standard deviations, a first five minutes that closes up, buy 1 NQ at 09:35 New York time, sell at 10:00, no stop.
- Why caution: 18 trades (about 4 a year), the rule was picked from 9 candidates, drops of −2 to −1.5 do not rebound, and many trades fall on stress days. Without the three best trades the average is +26.4 points.
- The numbers are the author’s; the raw data are not published, so nobody can re-run them. A forward paper test with no parameter changes began on 14 October 2026.
Short answer. One careful study says yes, and its author says “not proven”. After an unusually large overnight drop in Nasdaq-100 futures, if the first five minutes after the 09:30 open close up, buying at 09:35 and selling at 10:00 earned about +51 points net per trade on 18 out-of-sample trades (t = 2.49).1 It is rare to see a result described so carefully, and it is still 18 trades.
What is the rule?
The rule was frozen on 14 October 2026 and picked from nine pre-registered candidates (three drop thresholds times three first-five-minute filters) using the training data only.1
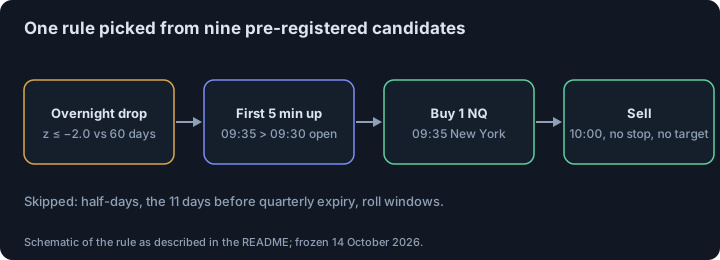
- Overnight return = the 09:30 open ÷ the previous 16:00 close − 1. Its size z is this return divided by the standard deviation of the overnight return over the previous 60 days. Condition: z ≤ −2.0.
- First five minutes: the price at 09:35 is above the 09:30 open.
- Trade: buy 1 NQ at 09:35 New York time, sell at 10:00. No stop, no target.
- Skipped: half-days and the 11 days before quarterly expiry; roll windows are excluded.1
The data are NQ front-month 1- and 5-minute bars from June 2016 to October 2026, not back-adjusted.1 The author models costs as 1 tick of slippage per side plus $4.50 in fees, about 0.7 points a round trip, with 1 point = $20.1
What did the study find?
Net of costs: training (2016 to 2021) 38 trades, +7.9 points, t = 1.86; validation (2022–2023) 8 trades, +49.3, t = 1.54; test (2024 to October 2026) 10 trades, +52.2, t = 1.87. All out-of-sample trades together: 18 trades, +50.9 points, 61% winners, t = 2.49 (p ≈ 0.01), worst trade −120 points (25 January 2022).1
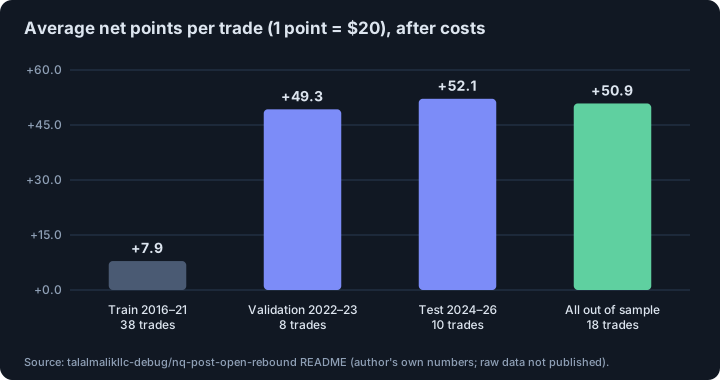
The out-of-sample average is about six times the training average, on very few trades. That alone is a reason for caution: it could be a real effect that grew, or a handful of unusual days.
How robust is it, according to the author?
Out-of-sample, base costs: median +52.4 points; without the best trade +41.4; without the three best +26.4; bootstrap 95% range of the average +11.6 to +90.7. Entering one minute late with extreme costs still gave +57.7.1
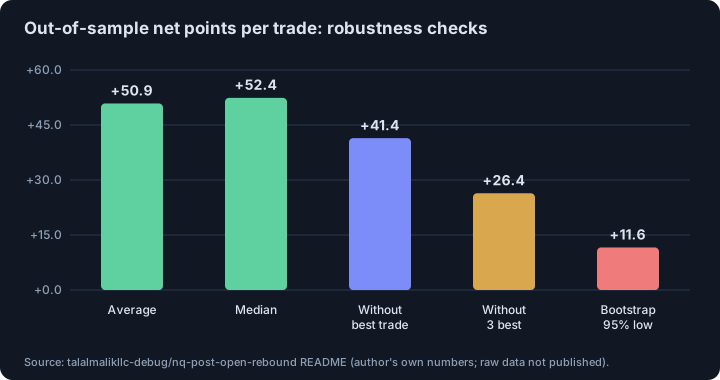
The result stays positive in every check, which is a good sign. What shrinks is the size: with 18 trades, the plausible range for the true average runs from a fraction of the headline to more than the headline.
What does the author say is wrong with it?
The README lists the limits itself:1
- Only 18 out-of-sample trades, about four a year.
- Multiple testing: the rule was picked from nine candidates, and later periods were looked at more than once.
- The effect is not monotonic: drops between −2 and −1.5 standard deviations do not rebound.
- Many trades fall on stress days (24 February 2022, 5 August 2024, April 2025), when real slippage may be worse than modelled.
- Costs come from trade prints, not bid and ask quotes.
- No risk management: one contract, no stop.
The author’s next step is forward paper trading from 14 October 2026 with no parameter changes, aiming for 20–30 new trades.1 That is the right test, and it will take months. For why small samples mislead, see how many trades you need to validate a strategy.
What do we take from it?
It is a good example of the method, more than of a rule: a fixed list of candidates, selection on training data, a validation and a test period, costs, a robustness section and a list of the author’s own doubts. Compare it with the usual backtest in why backtests lie and data snooping and the reality check.
As a trade it is only a hypothesis: no stop, results that cluster on stress days, fills the data cannot confirm, and nobody outside the author has re-run it. A day-trading edge on futures also has to survive slippage and price impact and the base rate described in do day traders make money. Our own related reading: does the QQQ opening range breakout work out of sample? and does the rest of the day predict NQ’s last 30 minutes?.
This is educational material, not investment advice.
Related. Does the rest of the day predict NQ’s last 30 minutes?
Footnotes
-
talalmalikllc-debug, “nq-post-open-rebound” (GitHub README, read; raw data not published for licensing reasons, code and numbers not re-run). NQ continuous front-month, June 2016 – October 2026; splits: train 2016-08 to 2021, validation 2022–2023, test 2024 to October 2026. All numbers are the author’s own. According to the README the project began as a replication of Iwanaga and Sakemoto (2026, SSRN 5807282); we did not open that paper. ↩ ↩2 ↩3 ↩4 ↩5 ↩6 ↩7 ↩8 ↩9
Frequently asked questions
Does NQ bounce after a large overnight drop?
In one pre-registered study, after an overnight drop of at least two standard deviations and a first five minutes that closed up, NQ gained about 51 points net between 09:35 and 10:00 on average over 18 out-of-sample trades (t = 2.49). The sample is small and the author calls it promising but not proven.
What does pre-registered mean in a backtest?
The candidate rules and the way of choosing among them are written down before looking at the test data, and the choice is made on training data only. It does not remove the risk of luck, but it limits how many rules can be tried until one fits.
Why are 18 trades not enough?
With so few trades a handful of days can drive the average: here the average falls from +50.9 to +26.4 points without the three best trades, and the bootstrap 95% range starts at +11.6.
Can I trade this rule?
It is a hypothesis awaiting a forward test, not a rule to trade: it has no stop, risks a 120-point loss on a single day (the worst so far), and its results cluster on stress days when fills are worse than modelled.
Sources
- nq-post-open-rebound: pre-registered quant study (README). talalmalikllc-debug, open GitHub research project; rule frozen 14 October 2026, data June 2016 – October 2026, 2026
This article is research, not investment advice. Results on history do not guarantee future results.