
- Short answer: a similar rule kept a small positive average (+0.07R per trade before costs) on QQQ from 2023 to September 2026, but it fell to +0.02…0.05R after assumed costs, and the author’s interval for net R includes zero.
- The 2023 paper’s 675% (against 169% for buy-and-hold QQQ) came from a 24% win rate, fills at the second candle’s open and no slippage; it is the authors’ own backtest on 2016 – February 2023.
- The independent test is not a replication: it uses different rules (a 15-minute range, close-confirmed entry, exit at 15:00). It shows how small the edge becomes under plainer assumptions, not that the paper is wrong.
- 2026 was negative for every variant, while 2025 alone gave about half of the out-of-sample total.
Short answer. Partly, and much less than the headline. A 2023 paper reported that a 5-minute opening range breakout on QQQ turned $25,000 into $192,806 in seven years. An independent researcher then fixed his own rules on 2017–2022 and ran them once on 2023 – September 2026. The average stayed positive before costs (+0.07R per trade), shrank to +0.02…0.05R after assumed costs, and 2026 was a losing year.1
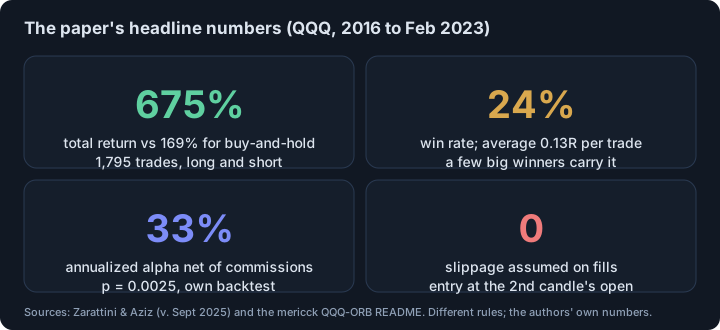
What did the QQQ opening range paper actually claim?
Zarattini and Aziz buy QQQ at the open of the second 5-minute candle if the first candle closed up, and sell short if it closed down. The stop is the first candle’s low (long) or high (short); the target is 10R or the close, whichever comes first; each trade risks 1% of the account, capped by a 4x intraday leverage limit, with commissions of $0.0005 per share.2
For 1 January 2016 – 17 February 2023 they report 1,795 trades, a 24% win rate, an average of 0.13R per trade, a Sharpe ratio of 1.12, a total return of 675% against 169% for buy-and-hold QQQ and an annualized alpha of 33% (p = 0.0025).2 They add that fills are assumed with no slippage, and that the most dramatic variant in their sensitivity study (a stop of 5% of the 14-day ATR on TQQQ, 9,350%) may be unrealistic because the stop would be about $0.08 wide.2
What did an independent test find on newer data?
A GitHub project by mericck takes the same idea but sets its own rules. Opening range 09:30–09:45; a candle must close beyond it; entry at the next open; stop on the other side of the range; target 2R; forced exit at 15:00; one trade a day. Parameters were searched on 2017–2022 (120 combinations), and 2023 – September 2026 was kept for one final test.1
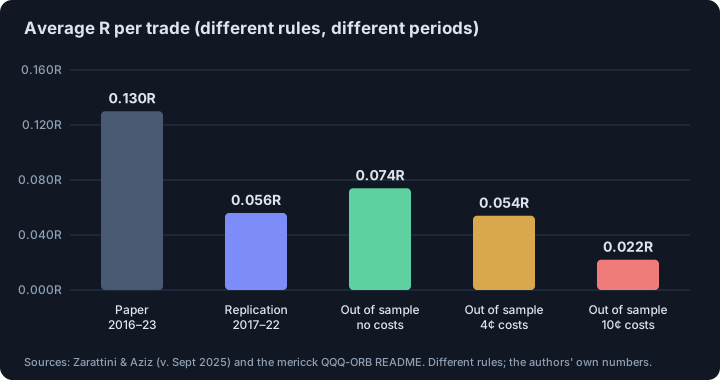
Out of sample, before costs, the primary variant made 906 trades with a 42.6% win rate and +0.074R on average (+67.3R in total); the baseline variant made 928 trades and +0.070R. With hypothetical costs of 4 cents per share round trip the primary average falls to +0.054R, and at 10 cents to +0.022R.1 The author runs a bootstrap and reports that under the 4-cent assumption the 95% interval for the average net R includes zero.1
Why is the independent edge so much smaller than the headline?
Several things differ, and none of them is a mistake by anyone:
- Different rules. The paper trades the direction of the first candle with a 10R target and an end-of-day exit; the independent test waits for a close beyond a 15-minute range and exits at 15:00. The test’s author states plainly that it is not a replication.1
- Different periods. 2016 – February 2023 against 2023 – September 2026.
- Costs. The paper’s commission is $0.0005 a share with no slippage; the independent test tries 4 and 10 cents a round trip. A small average per trade is the first thing costs eat.
- Optimization. The paper’s own parameter search produced the 9,350% variant; the independent test’s best configuration on the development data did not clearly beat its baseline.1
Is the weak 2026 telling us something?
By year (total R, primary variant): 2023 +20.8, 2024 +18.9, 2025 +35.3, 2026 to September −7.7.1
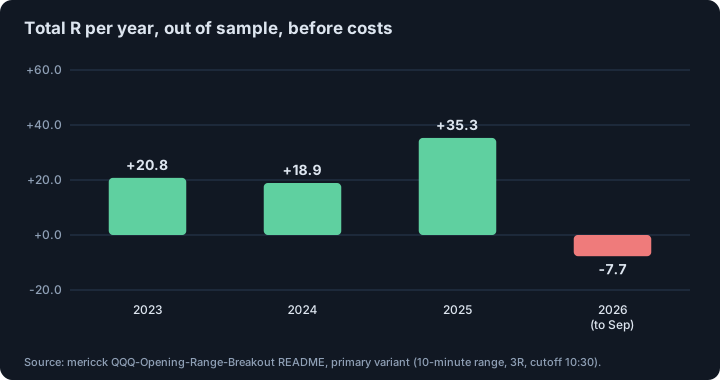
Three good years and one bad one cannot be told apart from a changing market, a fading edge or noise, which is why the author concludes that positive historical expectancy is “necessary but not sufficient”, and that the work is not a validated live-trading system.1 We agree with the way he frames it, and we would add the usual caveat about how many trades are needed to validate a strategy: with a total near +0.07R per trade, the sample needed to separate it from zero is large.
What would you need before trusting a day-trading edge like this?
- Fills on the real instrument. Both tests use QQQ candles; NQ futures or a CFD have different spreads, sessions and slippage. See slippage and price impact.
- A rule fixed before the test and one look at the final period, as the independent author did, instead of choosing the best of many variants (why backtests lie, data-snooping and the reality check).
- Forward results. Neither source has live trading results.
- A realistic view of the base rates. Most day traders lose money after costs: see do day traders make money.
This is educational material, not investment advice.
Related. How many trades do you need to validate a strategy?
Footnotes
-
mericck, “QQQ-Opening-Range-Breakout” (GitHub README, read; code and data not opened). QQQ 5-minute bars from Alpaca, January 2017 – September 2026; development 2017–2022 (1,504 sessions), out of sample January 2023 – September 2026. Numbers are the author’s own; the rules differ from the paper, as the author states. ↩ ↩2 ↩3 ↩4 ↩5 ↩6 ↩7 ↩8
-
Zarattini, C. and Aziz, A., “Can Day Trading Really Be Profitable?”, version of 22 September 2025 (SSRN 4416622), full text read. Test period 1 January 2016 – 17 February 2023, QQQ and TQQQ, start capital $25,000, maximum leverage 4x, commission $0.0005 per share, no slippage; the numbers are the authors’ own backtest. ↩ ↩2 ↩3
Frequently asked questions
What is the opening range breakout strategy on QQQ?
In the 2023 paper: buy at the open of the second 5-minute candle if the first one closed up (sell short if it closed down), stop at the first candle’s low or high, exit at 10R or the close, risk 1% of the account per trade.
Does the QQQ opening range breakout still work?
In one independent out-of-sample test (2023 – September 2026, different rules) the average was about +0.07R per trade before costs and +0.02…0.05R after assumed costs, with a negative 2026. Whether it works for you depends on fills and costs that no backtest on candle data shows.
Why is the win rate only 24% in the paper?
The 10R target is rarely reached, and the stop sits at the first candle’s extreme, so most trades are small losses; a few large winners and end-of-day exits produce the 0.13R average.
Is the independent test a replication of the paper?
No. The author says so himself: the entry (close beyond a 15-minute range), target (2R–3R), exit time and data differ, so it can neither confirm nor refute the paper’s returns.
Sources
- Can Day Trading Really Be Profitable? Evidence of Sustainable Long-term Profits from Opening Range Breakout (ORB) Day Trading Strategy vs. Benchmark in the US Stock Market. Carlo Zarattini (Concretum Research) and Andrew Aziz (Bear Bull Traders). Version of 22 September 2025 (first version April 2023); SSRN 4416622, 2025
- QQQ-Opening-Range-Breakout: out-of-sample performance, robustness testing and prop-firm feasibility (README). mericck, open GitHub research project, data January 2017 – September 2026, 2026
This article is research, not investment advice. Results on history do not guarantee future results.