
- Short answer: yes, in the published table. For NQ (April 1996 – May 2020) the return from the previous close to 30 minutes before the close predicts the last half-hour with the same sign: coefficient 6.36, t-statistic 7.97, out-of-sample R² 3.76%.
- The same pattern appears in more than 60 futures (equities, bonds, commodities, currencies) between 1974 and 2020; NQ has the highest out-of-sample R² among the four rows shown here (NQ 3.76%, all markets 2.88%, ES 2.29%, YM 2.18%).
- The authors explain it with the hedging of short-gamma positions by option market makers and leveraged ETFs, and find that it reverts over the next days.
- Under 4% of the last half-hour’s variation is explained, the sample ends in May 2020, and the paper measures predictability, not a trading profit after costs.
Short answer. In the published table, yes: for Nasdaq-100 futures the return of the whole day up to 30 minutes before the close predicts the last half-hour with the same sign. The statistics are strong (t = 7.97), but the share of the last half-hour’s variation it explains is small, under 4%, and the paper does not claim a trading profit.1
What exactly does the paper measure?
Baltussen, Da, Lammers and Martens (Journal of Financial Economics, 2021) take intraday returns on more than 60 futures: equity indices, bonds, commodities and currencies, between 1974 and 2020.1 They define a trading day as the 24 hours from one market close to the next and split it into overnight, the first half-hour, the middle of the day, the second-to-last half-hour and the last half-hour. “Rest of day” is everything except the last half-hour, and it is the predictor.1
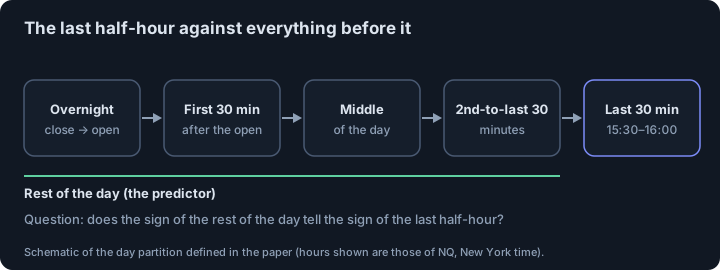
Their finding in one sentence: the return during the last 30 minutes before the close is positively predicted by the return during the rest of the day, in a way that is statistically strong and reverts over the next days.1 For NQ the sample is 12 April 1996 – 1 May 2020, with the cash-session hours of 09:30–16:00.1
What do the NQ numbers say?
In the table of individual regressions for the rest-of-day predictor, NQ shows a coefficient of 6.36 with a t-statistic of 7.97, an in-sample R² of 4.10% and an out-of-sample R² of 3.76%. The same table gives E-mini S&P 500 6.18 (t = 4.97; 3.41% and 2.29%), Dow futures 5.02 (t = 4.12; 2.20% and 2.18%), and 2.88% out of sample for all markets pooled.1
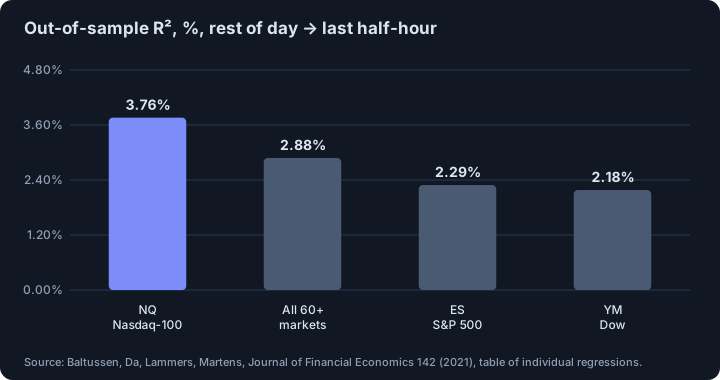
So the Nasdaq-100 is one of the stronger rows in this table, and every row shown is positive. The coefficients are reported as printed in the paper’s table; we did not re-estimate them.
Why would the end of the day follow the rest of the day?
The authors’ explanation is hedging. Market makers in options, and the providers of leveraged and inverse ETFs, are typically short gamma. To stay delta-neutral they have to buy as prices rise and sell as they fall, and the authors argue that much of this rebalancing falls in the last half-hour. Trading in the direction of the day’s move adds momentum to it.1 They also report that the effect reverts over the next days.1
This is a mechanism proposed and tested in the paper, not a law of the market. It is also one reason to be careful with extrapolation: positioning in options and leveraged ETFs changes over time.
What does a 4% R² mean for a trader?
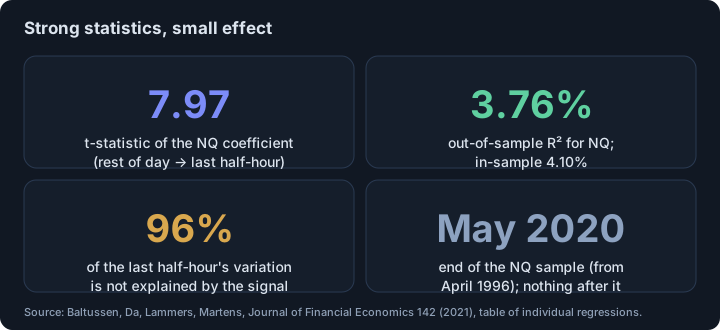
R² tells you how much of the variation in the last half-hour the signal accounts for: about 4% in sample and 3.76% out of sample for NQ, so about 96% is left unexplained. A very significant statistic over 24 years of data can still be a small effect on any one day, and the table does not include spread, commissions or slippage. The last half-hour is also an active period of the session, which matters for the cost of getting in and out. See slippage and price impact.
The honest reading: a robust statistical regularity of the sign of the last half-hour, which makes it a good hypothesis for a test with real costs, and not a signal.
What is still not known?
- Whether it can be traded after costs. The paper measures predictability; no entry, stop or exit rule is taken from it here.
- What happened after May 2020. The NQ sample ends there.
- Whether the effect is stable over time. Hedging demand changes with the size of the option and leveraged-ETF markets.
- How it behaves on a specific contract and broker, including the close of the futures session against the cash close.
We have not tested this on our own data, and we are not presenting it as a rule. It is a candidate for a test on NQ futures with real costs, split by time, with the rule fixed in advance: see how many trades you need to validate a strategy and why backtests lie.
This is educational material, not investment advice.
Related. Does the QQQ opening range breakout work out of sample?
Footnotes
-
Baltussen, G., Da, Z., Lammers, S., Martens, M., “Hedging demand and market intraday momentum”, Journal of Financial Economics 142 (2021) 377–403 (author’s copy read: abstract, definitions, sample table and the table of individual regressions). NQ: 12 April 1996 – 1 May 2020, 09:30–16:00. Regression coefficients and R² are quoted as printed in the table; the full sample covers 1974–2020 across more than 60 futures. ↩ ↩2 ↩3 ↩4 ↩5 ↩6 ↩7 ↩8
Frequently asked questions
Does the first half of the day predict the end of the day in Nasdaq futures?
The paper’s measure is the return from the previous close to 30 minutes before the close (the rest of the day). For NQ it predicts the last half-hour with the same sign (coefficient 6.36, t = 7.97, out-of-sample R² 3.76%); the effect is statistically strong but explains a small share of the variation.
Why would the last 30 minutes of the day follow the rest of the day?
The authors link it to gamma hedging: market makers in options and leveraged ETFs are typically short gamma, so they buy as prices rise and sell as they fall, and the authors argue that much of this rebalancing falls in the last half-hour, which pushes the move.
Is this a profitable strategy for NQ?
The paper does not claim that. It measures predictability; whether it can be traded after spread, commissions and slippage in the last half-hour is a separate question that the table does not answer.
Does the result still hold after 2020?
The NQ sample ends on 1 May 2020, so the paper cannot say. Any later period needs its own test.
Sources
- Hedging demand and market intraday momentum. Guido Baltussen, Zhi Da, Sten Lammers, Martin Martens. Journal of Financial Economics 142 (2021) 377–403, DOI 10.1016/j.jfineco.2021.04.029, 2021
This article is research, not investment advice. Results on history do not guarantee future results.