
Premium and discount in ICT: how it works
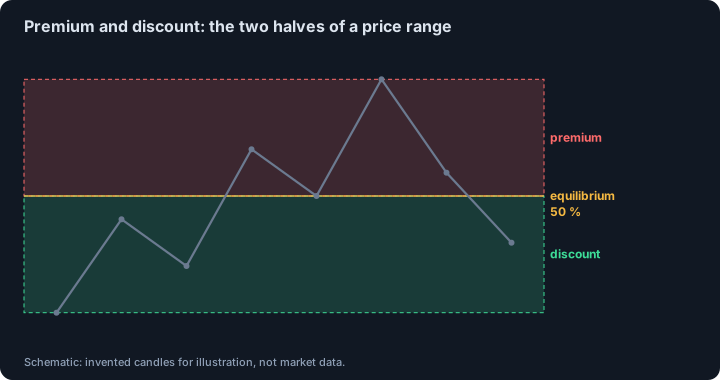
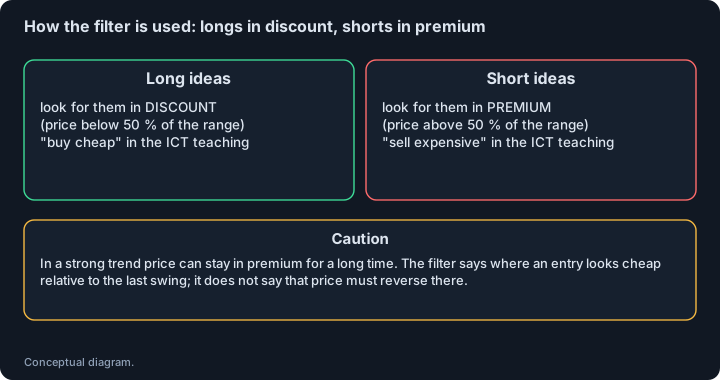
Premium and discount split a price range into two halves around its midpoint, called the equilibrium. Prices above the midpoint are premium (expensive within the range) and prices below are discount (cheap). The ICT-style rule of thumb is to look for longs in discount and shorts in premium. It is a filter on where to look, not a signal, and it says nothing about whether price must turn there.
- Definition: take a dealing range, the leg between a meaningful swing low and swing high, and split it at 50%. The midpoint is the equilibrium; above it is premium, below it is discount.
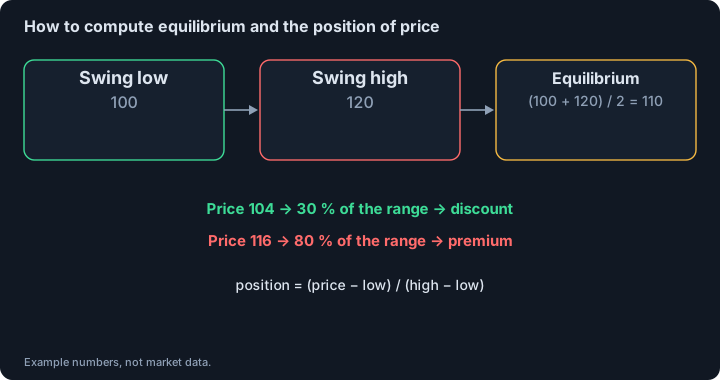
- Formula: equilibrium = (high + low) / 2; position of a price = (price − low) / (high − low). Above 0.5 is premium, below is discount.
- Use: a filter against chasing, longs sought in discount and shorts in premium. It is context, not an entry signal.
- Range choice is discretionary. Different swing choices give different zones, and a premium on a lower timeframe can be discount on a higher one. Define your anchors in advance.
- Old roots: the idea of the 50 percent retracement is much older than ICT. A Federal Reserve Bank of New York paper on support and resistance mentions a "50 percent rule" among the methods analysts use, and a vendor's documentation attributes earlier roots to W. D. Gann and floor traders.
- Research: we found no peer-reviewed test of premium and discount. Research on position within a range points the other way for stocks: closeness to the 52-week high has predicted higher returns, so "premium" is not automatically a place to sell. Trending markets can stay on one side of the midpoint for long periods.
Last reviewed: 2026-10-26
What are premium and discount?
Premium and discount are a way of describing where price sits inside a range. The range is the dealing range: the leg between a meaningful swing low and swing high, usually the latest leg that swept liquidity or broke structure. The midpoint of the range is the equilibrium. Price above the equilibrium is trading at a premium to the range, and price below it at a discount. The vocabulary comes from the ICT teaching; the idea of splitting a move in half is older.
How to calculate premium and discount (with an example)
Take the swing low and the swing high of the range you care about. The equilibrium is the average of the two. If the low is 100 and the high is 120, the equilibrium is 110. The position of a price is its distance from the low divided by the range height: a price of 104 is at 0.30 of the range and is in discount, and 116 is at 0.80 and is in premium. Many traders also mark the quadrant levels at 25 and 75 percent.
How the filter is used: longs in discount, shorts in premium
In a bullish read, the trader waits for a pullback into discount and then looks for an entry array, such as an order block or a fair value gap. In a bearish read the logic is mirrored in premium. The reasoning given is that range extremes carry resting orders, so buying in discount often follows a sweep of lows, while buying in premium means paying near levels likely to be sold. From a discount entry the first target is often the equilibrium, then liquidity on the premium side. Used this way, premium and discount grade an entry by its location; the split gives no direction by itself, so it is usually paired with a structure read.
Which range to use? Nested ranges and timeframes
Range selection is discretionary. Drawing the range from minor swings gives arbitrary midpoints, and changing the anchors mid-analysis changes the answer. Ranges are also nested: a premium on a lower timeframe can be a discount on a higher one, and the higher-timeframe reading usually takes precedence. The practical rule is to define the anchors by a written rule, for example the latest leg that broke structure, and to redraw only when the range changes, such as a close beyond an extreme.
A real example on BTCUSDT
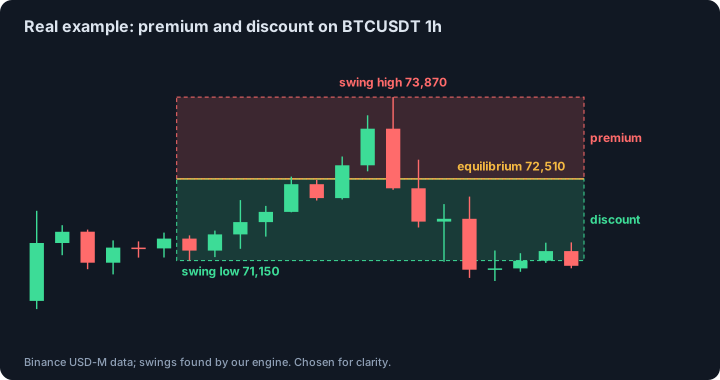
The chart shows BTCUSDT perpetual, 1h, on 13 March 2026. The swing low at 71,150 and swing high at 73,870 are found by our engine; the equilibrium is 72,510. Price falls back from the high into the discount half. The example was chosen because the leg is easy to read. It says nothing about what happens after price enters discount.
What research says: the 50 percent rule and position in a range
Carol Osler of the Federal Reserve Bank of New York lists the "50 percent rule" among the methods analysts use to find support and resistance levels, citing Pring: a major move is often reversed by about half in its first major correction. She also notes that the firms in her sample explained their levels with approaches that included such rules. Her test covered the published levels as a group, in currency markets from 1996 to 1998, and found that they predicted intraday trend interruptions. It did not test the 50 percent rule on its own.
For the position of a price within a range, the best-known academic result points the other way. T. J. George and C.-Y. Hwang (Journal of Finance, 2004) found that how close a stock's price is to its 52-week high is a strong predictor of future returns and accounts for much of the profit of momentum strategies. Stocks near the top of their range did well, not badly. That is a different range, a different horizon and a different market from an intraday dealing range, so it does not contradict the ICT rule, but it is a warning that premium is not automatically a place to sell.
We found no peer-reviewed test of premium and discount as a filter. A source we read states the limit itself: trending markets can stay on the wrong side of the midpoint for long periods.
How premium and discount connect to OTE, order blocks and FVG
The 62 to 79 percent zone of optimal trade entry sits inside the discount half of a rally by construction. Order blocks and fair value gaps are judged by their location: arrays in deeper discount are generally ranked higher for longs. Premium and discount are also sometimes combined with kill zones, with discount entries ranked higher when they form in the London or New York windows. Combined filters make setups rarer, not necessarily better.
How to test premium and discount yourself
Write the rule before you look at results: how the range is chosen, which timeframe, how deep in discount you require. Count every setup the rule finds. Include fees. Split the data in time and compare with entries at random positions in the range that use the same stop and target. If entries in discount do no better than entries elsewhere, the split is a description of the chart and not a filter that adds anything.
Our scanner does not draw premium or discount zones. The formula is simple: position = (price − low) / (high − low). You can compute it for any swing pair; the chart above uses two swings found by our engine.
Common mistakes
- Drawing the range from minor swings, which gives arbitrary midpoints.
- Changing the anchors after price moved so that the entry looks like discount.
- Treating the midpoint as a support or resistance level that must hold.
- Treating the 50 percent split as an entry signal rather than a filter.
- Ignoring nested ranges: a premium on one timeframe can be a discount on another.
- Using it in a strong trend without a rule for stepping aside.
This page describes a concept, not a signal. We found no peer-reviewed test of these rules; the independent research we did find is listed under Sources.
Sources and further reading
- LuxAlgo Library: Premium & Discount. A vendor's documentation: dealing range, equilibrium, how the split is used, nested ranges and common mistakes. Not an independent study. We read the page.
- Osler, C. (2000). Support for resistance: technical analysis and intraday exchange rates. Federal Reserve Bank of New York Economic Policy Review 6(2), 53-68. Lists the 50 percent rule and Fibonacci ratios among the methods analysts use; published levels predicted intraday trend interruptions, 1996 to 1998. We read the full paper.
- George, T. J. and Hwang, C.-Y. (2004). The 52-week high and momentum investing. Journal of Finance 59(5), 2145-2176. Closeness to the 52-week high predicts future stock returns and accounts for much of momentum profits. We read the abstract as summarised in indexes; the full text is paywalled.
- OrderBlock.net: what is optimal trade entry The 62 to 79 percent zone inside the discount half.
- OrderBlock.net: what is an order block Arrays that are judged by their location in the range.
See also
Educational material about chart concepts. Not financial advice and not a promise of profit.