
BOS vs CHoCH: what is the difference?
A break of structure (BOS) is a close beyond the last swing point in the direction of the trend, so the trend continues. A change of character (CHoCH) is the first close beyond the last swing against the trend, for example below the last higher low in an uptrend, which is an early warning that the trend may be changing. Both depend entirely on how swings are defined, and a lone CHoCH often fails.
- BOS: a break of the latest swing in the trend's direction (continuation). CHoCH: the first break of the latest counter-trend swing (a possible turn). The mechanics are identical; the meaning is opposite.
- Everything depends on two choices: how a swing is defined, and whether a break needs a close or only a wick. Sources differ on both. One vendor's documentation advises picking one convention and applying it consistently.
- Roots: Dow Theory. In William Peter Hamilton's 1922 book the signals are read on closing prices and need confirmation. The modern checklist of higher highs and higher lows is a later summary, not a rule stated in the chapters we read.
- Research on chart reading: Lo, Mamaysky and Wang (Journal of Finance, 2000) note that judging chart shapes is highly subjective, automated pattern detection with kernel regression on US stocks from 1962 to 1996, and found several patterns added information. That is a different method from BOS and CHoCH.
- A lone CHoCH is evidence, not confirmation. Many frameworks wait for a lower high after the break and then a BOS in the new direction.
- We found no peer-reviewed test of BOS or CHoCH as trading signals.
Last reviewed: 2026-10-26
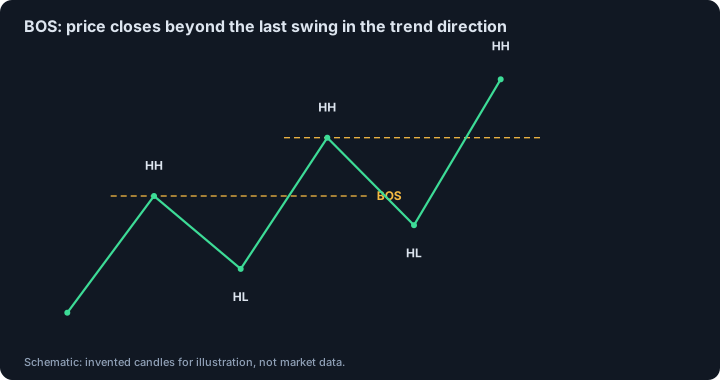
What is a break of structure (BOS)?
A break of structure is a break in the direction of the prevailing trend. In an uptrend, price trades through (or closes above, depending on the rule) the most recent significant swing high. In a downtrend, it goes through the most recent swing low. Because it continues the trend, a BOS is read as confirmation of the trend's structure. The trend has to be mapped first, using the sequence of higher highs and higher lows or the reverse, before a BOS can be identified. Labelling breaks before mapping the trend is a common mistake.
What is a change of character (CHoCH)?
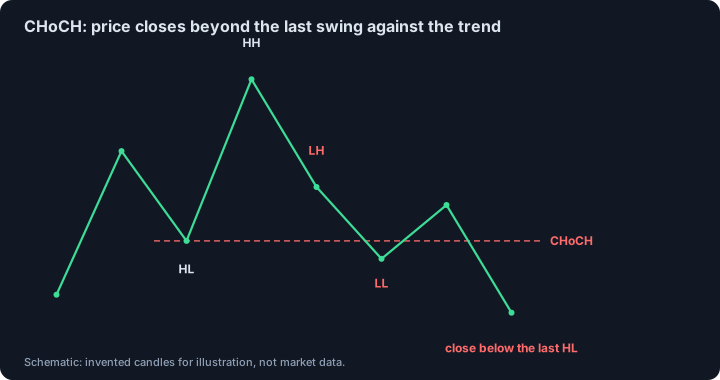
A change of character is the first break of structure against the prevailing trend. In an uptrend, price breaks the most recent meaningful higher low; in a downtrend, the most recent lower high. It is only meaningful relative to a defined trend. The strictest reading uses the higher low that produced the trend's final high. Looser readings accept any recent higher low, including internal ones, which signal shifts sooner and produce more false alarms.
A CHoCH says that the character of price has changed. It does not say the trend has reversed. Deep pullbacks in healthy trends can break a minor higher low and then resume, and many frameworks wait for a lower high after the break, followed by a BOS in the new direction, before treating a reversal as established.
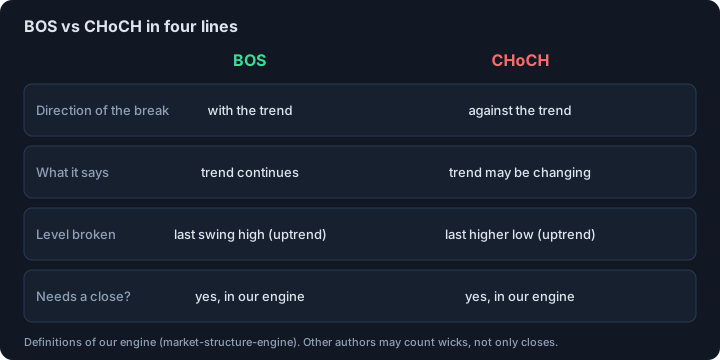
BOS vs CHoCH: the difference in four lines
The two use the same mechanics and point in opposite directions. A BOS breaks with the trend and suggests continuation; a CHoCH breaks the counter-trend swing and warns of a possible turn. In an uptrend, the BOS level is the last swing high and the CHoCH level is the last higher low. Some sources use BOS loosely for any structural break, so check the author's definition before comparing setups across sources.
How swings are defined: the choice that decides everything
A swing high is a candle whose high is above the highs of a few candles on each side, and a swing low is the mirror image. The number of candles on each side changes every result: a small number gives many minor swings and frequent labels, a large number gives few, significant swings. Many tools expose this as a pivot length. Increasing it focuses on longer-term structure, and decreasing it shows more minor, internal structure.
This subjectivity is old. Lo, Mamaysky and Wang, in a 2000 paper in the Journal of Finance, point out that judging whether a chart shows a particular shape is highly subjective and that pattern recognition often depends on the observer. Their answer was to define patterns by an automated procedure, using nonparametric kernel regression to smooth prices and find extrema, and to compare returns after the patterns with unconditional returns. On US stocks from 1962 to 1996 they found that several patterns added information beyond the unconditional distribution. That result is about their smoothing-based patterns and not about BOS and CHoCH, but the method is the lesson: write the swing rule down and apply it mechanically.
Our engine uses a fractal rule with k = 2 (a swing needs two lower highs on each side, so it is confirmed two bars later) and counts a break only on a close.
Close or wick? Why the rule matters
Conventions differ. A wick-based break is detected earlier, but a wick-only poke through a level frequently turns out to be a liquidity sweep, and the next bars show it. A close-based rule filters those out at the cost of a later signal. Some traders also check whether displacement, meaning large candles, accompanied the break to judge its quality. The closing-price principle is old: Hamilton's book, setting out Charles Dow's theory, reads its signals on closing prices only.
Mixing wick and close rules inside one analysis distorts results. Decide once, and say which one you use.
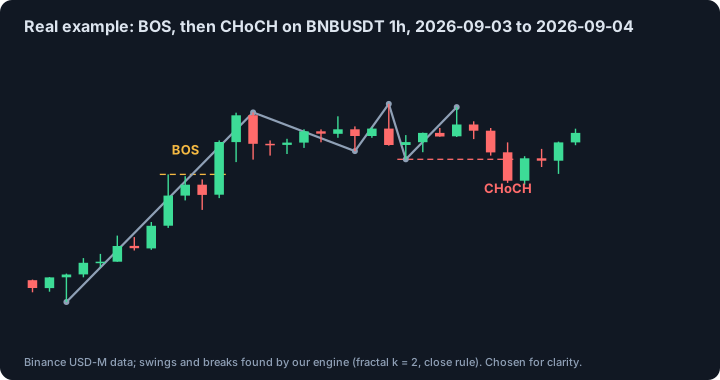
A real example: a BOS, then a CHoCH
The chart shows BNBUSDT perpetual, 1h, on 3 to 4 September 2026, with swing points found by our engine joined by a line. Price closes above the previous swing high (BOS), makes a higher high, and later closes below the last higher low (CHoCH). The example was chosen because the swings are easy to read; many structures are far messier, and the CHoCH here says nothing about what happened next.
Where the idea comes from: Dow Theory
Trend structure goes back to Charles Dow, whose theory William Peter Hamilton set out in The Stock Market Barometer (1922). In it a primary movement is the bull or bear market, a secondary movement is a sharp reaction against it, and signals are read on closing prices and need confirmation by a second average. A break out of a trading range on closing prices signals a change of at least secondary character if the other average confirms it. This is the ancestor of the idea that a break against the trend is a first warning and not proof.
The book states these ideas in plain words and gives no systematic results. The modern checklist of higher highs and higher lows in both averages is a later summary and is not stated as a rule in the chapters we read. See our Rulebook page on Hamilton for the passages we checked.
How to mark BOS and CHoCH on a chart, step by step
(1) Fix your swing rule, for example a fractal with a given half-width, and your break rule, close or wick. (2) Mark swing highs and lows and map the trend: higher highs and higher lows is an uptrend. (3) In an uptrend, a break above the latest swing high is a BOS; label it only after the break has printed. (4) A break below the latest higher low is a CHoCH. (5) Keep internal and external structure apart: internal breaks flip sooner and are used for timing, external structure is used for direction. (6) Treat a lone CHoCH as a warning and wait for what your framework requires next.
How to test a structure rule yourself
Write the rule before you look at results: swing definition, close or wick, what counts as the trend, what you do after a BOS and after a CHoCH. Count every break the rule finds, including the ones that failed. Include fees. Split the data in time and compare with entries at random times with the same stop and target. If the rule does not beat random entries, structure breaks are a description of the chart and not an edge.
Our engine uses Williams-style fractals with k = 2 for swings (confirmed two bars later). A BOS is a bar that closes beyond the most recent unbroken swing in the direction of the prevailing trend. A CHoCH is a close beyond that swing against the trend, and the trend state flips. Both are known at the close of the breaking bar.
Common mistakes
- Labelling breaks before mapping the trend.
- Treating every breakout as a BOS: only breaks of the latest with-trend swing qualify.
- Calling every break against the move a CHoCH regardless of the trend context.
- Trading a lone CHoCH as an entry rather than a warning.
- Switching between wick and close rules, or between internal and external swings, in the same analysis.
- Confusing a CHoCH with a swing failure pattern, which is a wick through the trend extreme that closes back inside.
- Seeing the swing only in hindsight: a swing is confirmed a few bars after it forms.
This page describes a concept, not a signal. We found no peer-reviewed test of these rules; the independent research we did find is listed under Sources.
Sources and further reading
- Lo, A., Mamaysky, H. and Wang, J. (2000). Foundations of technical analysis: computational algorithms, statistical inference, and empirical implementation. Journal of Finance 55(4), 1705-1765. Automated pattern detection with kernel regression on US stocks, 1962 to 1996; several patterns add information. We read the NBER working paper summary (No. 7613).
- Hamilton, W. P. (1922). The Stock Market Barometer. Full text on the Internet Archive. Dow Theory as set out by Hamilton: closing prices, confirmation, primary and secondary movements. Public-domain book; we checked the passages in the full text.
- LuxAlgo Library: Break of Structure (BOS). A vendor's documentation: definition, close vs wick conventions, internal vs external structure, common mistakes. Not an independent study. We read the page.
- LuxAlgo Library: Change of Character (CHoCH). A vendor's documentation: definition, swing choice, relation to BOS and MSS, warning that a lone CHoCH often fails. Not an independent study. We read the page.
- OrderBlock.net Rulebook: William Peter Hamilton (Dow Theory) The Hamilton passages we checked and what the book does not state.
- OrderBlock.net: what is a market structure shift The stronger counter-trend break with displacement.
See also
Educational material about chart concepts. Not financial advice and not a promise of profit.