
What is a liquidity sweep (stop hunt)?
A liquidity sweep is a move where price runs through an obvious high or low, taking the stops placed there, and then closes back inside the old range. The wick through the level plus a close back inside is what makes it a sweep; a close that holds beyond the level is a breakout. What follows can be a reversal or a continuation, and a sweep alone does not tell you which.
- Definition: price trades through a level where resting orders cluster (equal highs or lows, a prior swing, a session extreme) and then closes back inside the range.
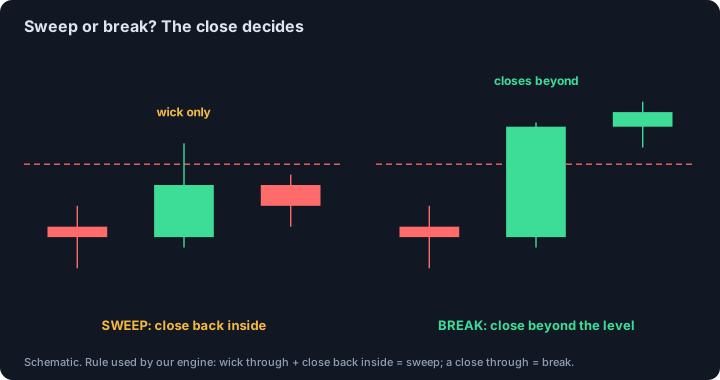
- Sweep or breakout: the close decides. A close that holds beyond the level is a breakout, not a sweep. Some traders require the close back inside on the sweeping candle itself, others accept a rejection within a few bars.
- Buy-side sweep = a high was run (buy stops taken). Sell-side sweep = a low was run (sell stops taken). The name says which orders were filled, not which way price goes next.
- Other names: stop hunt, stop run, liquidity grab, liquidity raid. They describe the same picture, and they add a claim about intent that a chart cannot show.
- What research shows: a Federal Reserve Bank of New York study found that currency rates move unusually fast when they reach levels where stop-loss orders cluster, with effects lasting hours, not days. It does not show that anyone triggers stops on purpose, and we found no peer-reviewed test of the sweep as a reversal signal.
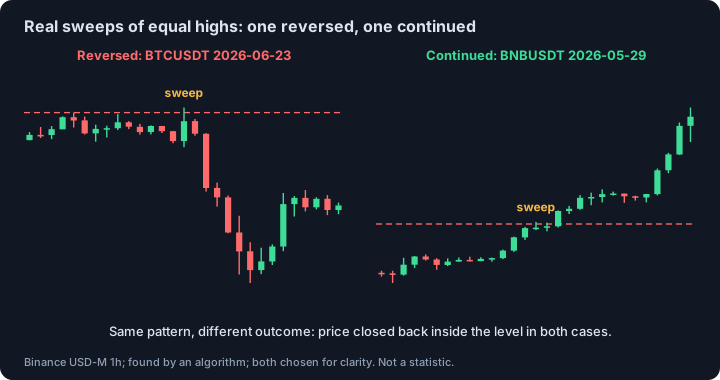
- After a sweep price can reverse or continue. Both are shown below on real charts.
Last reviewed: 2026-10-26
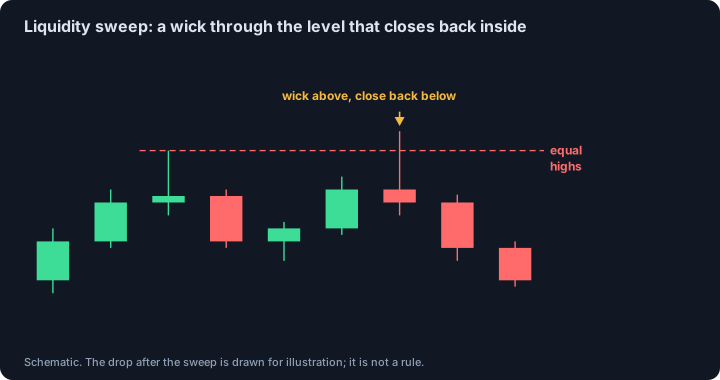
What is a liquidity sweep?
A liquidity sweep, also called a liquidity grab or raid, is a run through a level where stop-losses and breakout orders are assumed to rest: a prior swing high or low, equal highs or lows, or the extreme of a session or a day. After those orders are filled, price fails to hold beyond the level and returns inside the range. Traders read the move as liquidity being taken rather than as the start of a new trend. The idea behind it is explained on the liquidity page.
Liquidity sweep vs breakout: the close decides
Mark an obvious level, such as equal highs. If a candle wicks above it but closes back below, that is a sweep of buy-side liquidity. If a candle closes above the level and price holds there, it is a breakout. The two look identical until the close and the follow-through appear, which is why a run through a level should not be called a sweep before the failure has printed. Some traders require the close back inside on the sweeping candle itself; others accept a tag-and-reject that resolves within a few bars. Definitions differ, so check which standard a model or a course uses.
Buy-side sweep and sell-side sweep
Sweeps are named by the liquidity that was taken, not by the direction traders take afterwards. A buy-side sweep runs a high, taking buy stops of short sellers and breakout buy orders; it is often read as context for shorts. A sell-side sweep runs a low, taking sell stops of long holders and breakout sell orders; it is often read as context for longs. For that reason the LuxAlgo library, for example, uses buy-side and sell-side instead of bullish and bearish. Check the name against the orders that were taken.
Stop hunt, stop run, liquidity grab: one picture, several names
Stop hunt and stop run are older names for the same picture. They carry an extra claim, that someone does it on purpose. The research does not show that. Osler's analysis of currency orders documents that stop-loss orders cluster just beyond round numbers and that they can propagate trends, but it shows clustering and feedback, not intent. A wick through a level can be the result of ordinary buying and selling, and a chart cannot tell the difference.
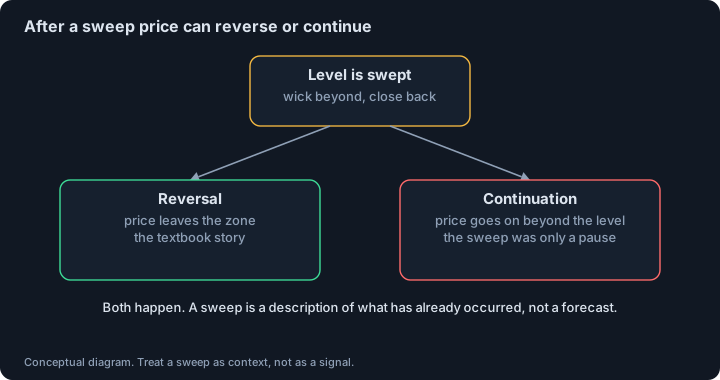
What happens after a sweep: reversal or continuation
Both happen. A sweep describes what has already occurred. It does not say what the next candle will do. The chart shows two real sweeps of equal highs on crypto perpetuals: after the first, price fell; after the second, price kept rising. In both cases the sweeping candle closed back below the level. If someone says a sweep always reverses, ask how many sweeps did not. Most smart money models therefore treat a sweep as context and wait for a structure shift or displacement before reading it as a reversal. Our market structure shift page covers that step.
Why stops can accelerate a move: how triggered orders behave
Orders resting beyond a level matter because of what they do when triggered. On Binance Futures, a stop-market order becomes a market order when its stop price is reached and executes immediately at the best available price, and Binance warns that market orders can slip. A triggered stop therefore adds a market order in the direction of the move, which pushes price further through the level. Osler's study of price cascades found that currency rates trend unusually fast when they reach levels where stop-loss orders cluster, that the response to stop-loss orders is larger and longer than the response to take-profit orders, and that most results hold for hours but not for days.
So the mechanism is plausible and partly documented. The gap is between the mechanism and the trade: a stop-driven run can end in a close back inside, and it can end in a breakout. Which of the two happens is the open question.
How to confirm a sweep
The common minimum is a trade through the level followed by a close back inside the range. Stricter versions also require displacement, meaning large candles away from the swept level, or a change of character on a lower timeframe, before the sweep is read as a reversal. Each added condition makes the pattern rarer and makes it easier to find on past charts; the way to know whether it adds anything is to test it with a rule written in advance.
Which levels count: equal highs, previous day and week extremes
Sweeps of widely watched levels, such as the previous day's high or low and session or weekly extremes, are usually given more weight than sweeps of minor swings on a one-minute chart, because more traders see them and more orders are assumed to rest there. Many intraday models pair a higher-timeframe swept level with a lower-timeframe entry. Equal highs and equal lows are marked as a band within a small fraction of ATR, because stops gather in a band and not at one price.
Where the idea is considered wrong
As it is taught, a reversal reading of a sweep is wrong if price trades back through the swept extreme. Stops are placed beyond the wick of the sweep, where the exit is unambiguous, and not inside the range where ordinary rotation occurs. This describes how the pattern is taught, not advice.
How to test a liquidity sweep rule yourself
Write the rule before you look at results: which levels count, how big the wick may be, whether the close must be on the sweeping candle, what confirmation is needed, and where entry, stop and target go. Count every sweep the rule finds, including the ones that continued. Include fees. Split the data in time and compare with entries at random times that use the same stop and target. If the rule does not beat random entries, the sweep is a description of the chart and not an edge.
Our engine calls it a sweep when a candle wicks through a level, either the extreme of equal highs or lows or a single swing, and closes back inside. A close through the level is a break instead. It is known at the close of the sweeping bar. It also tracks a sweep followed by a reversal CHoCH within 20 bars. The charts above were found with this rule.
Common mistakes
- Counting a close beyond the level as a sweep.
- Calling a run through a level a sweep before the close back inside has printed.
- Assuming a reversal. A sweep is a description, not a forecast.
- Choosing levels after the fact so that every reversal has a sweep.
- Mixing definitions: some traders count any wick through a level, others require the close on the same candle.
- Trading a sweep without waiting for any confirmation.
This page describes a concept, not a signal. We found no peer-reviewed test of these rules; the independent research we did find is listed under Sources.
Sources and further reading
- Osler, C. (2002). Stop-loss orders and price cascades in currency markets. Federal Reserve Bank of New York Staff Report 150. Rates trend unusually fast at levels where stop-loss orders cluster; the response to stop-loss orders is larger and longer than to take-profit orders; most results significant for hours, not days. We read the full paper.
- Osler, C. (2003). Currency orders and exchange rate dynamics: an explanation for the predictive success of technical analysis. Journal of Finance 58(5), 1791-1819. Working paper version, Federal Reserve Bank of New York Staff Report 125 (2001): stop-loss orders cluster just beyond round numbers. We read the full working paper.
- Binance Support: Types of Order on Binance Futures. Official description of stop-market and stop-limit orders and the slippage warning. We read the page.
- LuxAlgo Library: Liquidity Sweep. A vendor's documentation of the criteria, buy-side and sell-side naming, confirmation standards and follow-through. Not an independent study. We read the page.
- OrderBlock.net: what is liquidity in ICT and smart money Buy-side and sell-side liquidity, equal highs and lows, and the research on order clustering.
- OrderBlock.net: futures liquidation explained How forced orders work on futures exchanges.
See also
Educational material about chart concepts. Not financial advice and not a promise of profit.