
What is an order block (OB)?
An order block (OB) is a price zone taken from the last candle that moves against the coming impulse: the last down candle before a strong rally (bullish OB) or the last up candle before a strong drop (bearish OB). Traders watch the zone as a place where price may react when it comes back. Whether it does is a claim to test, not a rule.
- Definition: the last opposite-colour candle before an impulse that breaks market structure. The zone is its body (our engine) or its full range (some authors).
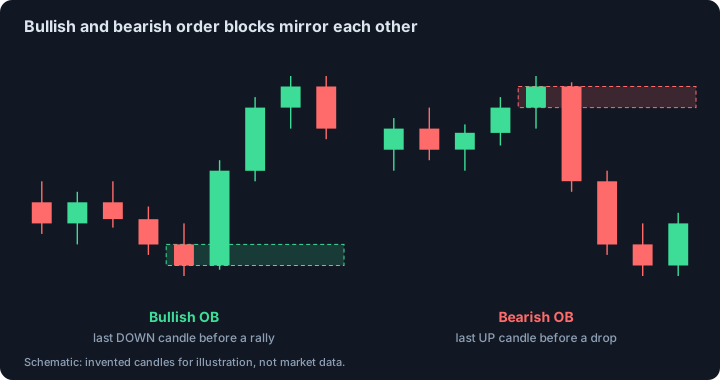
- Bullish OB = last down candle before a rally. Bearish OB = last up candle before a drop.
- Origin: the term is part of the ICT / smart money vocabulary. Its older cousins are supply and demand zones and support and resistance.
- What research supports: studies of real currency orders show that stop and take-profit orders cluster at obvious price levels, and that support and resistance levels coincide with peaks of depth in the limit order book.
- What it does not support: we found no peer-reviewed test of the order block rule itself.
Last reviewed: 2026-10-26
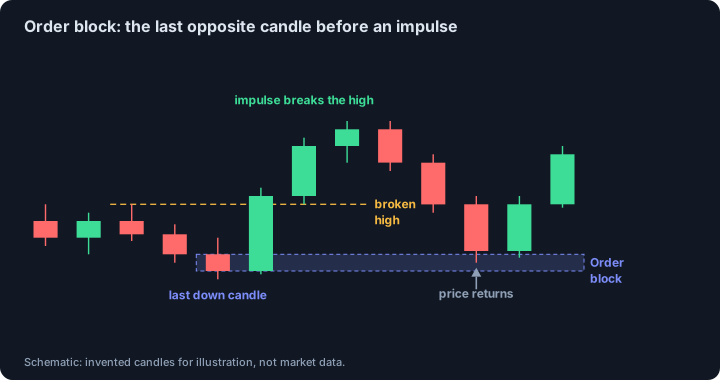
How an order block is built, step by step
Use the same five steps every time and write them down. (1) Find an impulse: one or several large candles that break a recent swing high or low. (2) Check that the move broke market structure (a BOS or CHoCH). (3) Step back to the last candle of the opposite colour before the impulse began. (4) Mark its price range as the zone. (5) Track the zone's state: fresh until price first touches it, mitigated after the first touch, invalidated when a candle closes through its far edge.
The idea behind it is that large players had to build a position before the move, so the area where they were active may matter when price returns. The chart cannot show who was trading, so this is an interpretation of the picture, not an observed fact.
Bullish and bearish order blocks
A bullish order block is the last down candle before a rally. A bearish order block is the last up candle before a drop. They are mirror images, and the same rules apply with the direction flipped.
A zone is usually considered stronger when the impulse after it breaks market structure and leaves a fair value gap behind. Those extras are optional filters used by different authors; they are not part of one agreed definition.
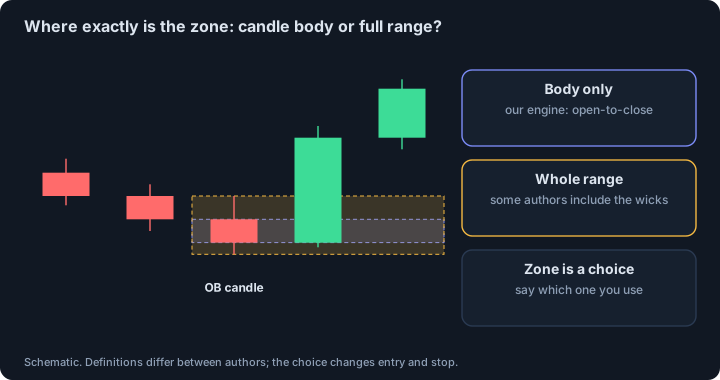
Which part of the candle is the zone?
Authors disagree. Some take the body (open to close), some take the whole range with wicks, and some mark the 50 percent level of the candle as the key price. The choice changes where you place the entry and the stop, so decide it once and write it down.
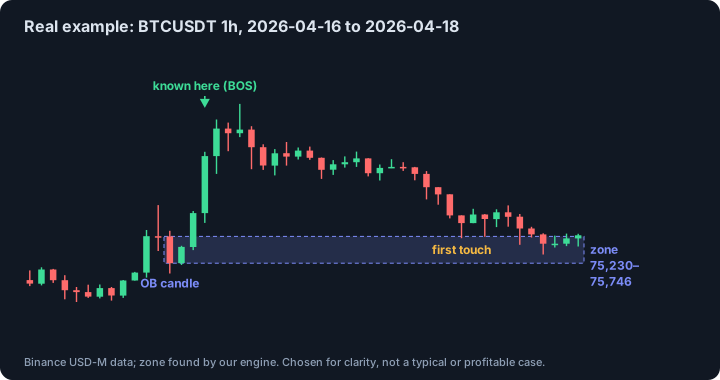
A real example on BTCUSDT
The chart shows a bullish order block found by our engine on BTCUSDT perpetual, 1h, on 16 to 18 April 2026. The zone spans 75,230 to 75,746, the impulse that broke structure was 3.5 times the average true range (ATR), and the zone became known only at the close of the breaking candle, not at the OB candle itself. Price returned to the zone about 22 candles later.
This case was picked because it is easy to read. It is not typical and it says nothing about profit.
Why would a zone matter? What research shows
The mechanism people point to is order clustering: many resting orders at the same obvious prices. This part has real evidence. Carol Osler of the Federal Reserve Bank of New York studied almost 9,700 stop-loss and take-profit orders placed at a large currency dealing bank between September 1999 and April 2000. She found that take-profit orders cluster at round numbers (9.3% of take-profit orders were at rates ending exactly in 00, against 4.4% of stop-loss orders), and that stop-loss orders cluster just beyond such levels: 14.4% of stop-loss buy orders sat just above a round number (01 to 10), against 7.4% just below it (90 to 99).
A follow-up study found that exchange-rate trends are unusually rapid when rates reach levels where stop-loss orders had been documented to cluster, and that the effect shows up over hours, not days. Separately, Kavajecz and Odders-White reported in the Review of Financial Studies (2004) that support and resistance levels coincide with peaks of depth in the limit order book.
Read the limits carefully. These are currency orders from one bank in 1999 to 2000 and a limit order book study of another market, not crypto futures. They document clusters at round numbers and chart levels, not at the body of the last opposite candle. And none of them tests whether trading an order block makes money. We read the abstracts of the Review of Financial Studies paper only, because the full text is behind a paywall.
Order block, supply and demand, support and resistance
Supply and demand zones and support and resistance levels are older ideas about prices where orders pile up. An order block is a narrower, rule-based version of the same thought: it must follow a specific candle and a specific impulse. If you already know supply and demand, you know the core of an order block. A zone that failed and is retested from the other side is called a breaker block, and the imbalance an impulse leaves behind is a fair value gap.
How to test an order block rule yourself
Write the rule before you look at results: which candle, body or range, which impulse size, which structure break, where the entry and stop go. Count every zone the rule finds, not only the ones that worked. Include fees. Split the data in time, build the rule on the first part and check it on the second. Compare with entries at random times that use the same stop and target. If the rule does not beat the random entries, the zone is a description of the chart and not an edge.
In our engine (the open-source poi-liquidity-detector) an order block is the last opposite-colour candle, up to 20 bars back, before a structure break whose impulse is at least 1.5 × ATR(14). The zone is the candle body. A zone is fresh until price first touches it, mitigated after the first touch, and invalidated when a candle closes through its far edge. Each zone carries the time it became known (the bar that broke structure), so nothing is drawn with hindsight.
Common mistakes
- Marking the candle before every move. A real order block needs an impulse that breaks structure.
- Drawing zones after the fact and forgetting that at the time you could not know which impulse would follow.
- Switching between body and full range depending on what fits the story.
- Treating the zone as a signal. Price often closes straight through it.
- Counting only the zones that worked. The test is every zone the rule finds.
This page describes a concept, not a signal. We found no peer-reviewed test of these rules; the independent research we did find is listed under Sources.
Sources and further reading
- Osler, C. (2003). Currency orders and exchange rate dynamics: an explanation for the predictive success of technical analysis. Journal of Finance 58(5), 1791-1819. Working paper version, Federal Reserve Bank of New York Staff Report 125 (2001): almost 9,700 stop-loss and take-profit orders, September 1999 to April 2000. We read the full working paper.
- Osler, C. (2002). Stop-loss orders and price cascades in currency markets. Federal Reserve Bank of New York Staff Report 150. Finds that rates trend unusually fast at levels where stop-loss orders cluster; most results are significant for hours, not days. We read the full paper.
- Kavajecz, K. and Odders-White, E. (2004). Technical analysis and liquidity provision. Review of Financial Studies 17(4), 1043-1071. Support and resistance levels coincide with peaks of depth in the limit order book. We read the abstract only; the full text is paywalled.
- OrderBlock.net: order flow imbalance and price impact Our summary of Cont, Kukanov and Stoikov on how order book events move price.
See also
Educational material about chart concepts. Not financial advice and not a promise of profit.