
What is a breaker block in trading?
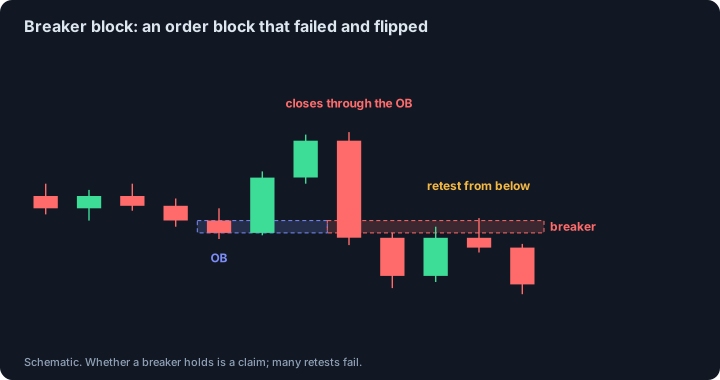
A breaker block is a failed order block. A zone that one side defended is overrun by price, and when price later comes back to it from the other side, the zone is watched with its roles reversed: a failed bullish order block becomes a bearish breaker, and a failed bearish order block becomes a bullish breaker. It is the order block version of the old idea that broken support turns into resistance.
- Definition: an order block that failed (price closed through it) and is then expected to act with the opposite polarity when price returns.
- Naming: a bullish breaker is built from the down-closing candles of a failed down leg; a bearish breaker from the up-closing candles of a failed up leg.
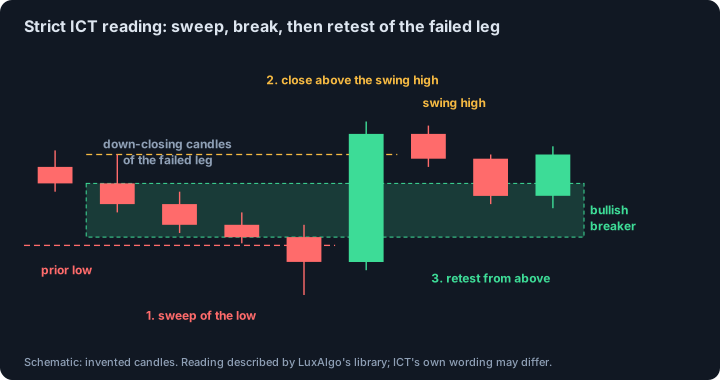
- Strict ICT reading: the failing swing first trades beyond a prior high or low (a liquidity sweep), then reverses and breaks structure. Loose reading: any violated order block is a breaker. A mitigation block is the same flip without the sweep.
- Old idea behind it: support that breaks becomes resistance (role reversal).
- What research says: a Federal Reserve Bank of New York study found that support and resistance levels published by six currency dealing firms predicted intraday trend interruptions (1996 to 1998). That supports support and resistance in general. We found no peer-reviewed test of breaker blocks.
- Conventions differ: bodies or full ranges, one candle or a series, and whether a sweep is required. State your rule before you mark anything.
Last reviewed: 2026-10-26
What is a breaker block?
A breaker block is a price zone that started as an order block and then failed. An order block is the last opposite candle before an impulse; it is expected to hold when price returns. If price instead closes through it, the expectation failed. The breaker idea is that the failed zone does not simply disappear: it flips. When price comes back, the zone is expected to act the other way, as resistance if it used to be demand, or as support if it used to be supply.
The term belongs to the ICT and smart money vocabulary. Different teachers define it a little differently, and the main disagreement is whether the failure must come with a liquidity sweep. We describe both readings below.
Breaker block vs order block: the key difference
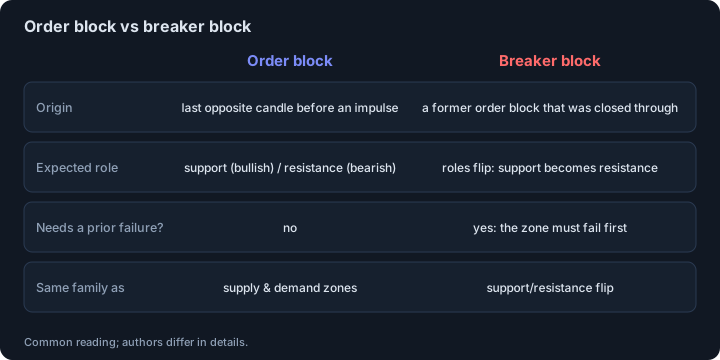
An order block is the last opposite candle before an impulse and is expected to hold in the direction of that impulse. A breaker is a block that did not hold, and the zone is expected to act in the opposite direction. The order of events matters: a zone that never failed is not a breaker, and a zone that failed but was never revisited is only a failed order block.
Bullish breaker block and bearish breaker block
Breakers are named by the role they are expected to play, not by the colour of the candles. A bullish breaker is expected to act as support, and it is built from the down-closing candles of a down leg that failed. A bearish breaker is expected to act as resistance, and it is built from the up-closing candles of an up leg that failed. Beginners often name them the other way round; check the role, not the colour.
Strict ICT breaker block rules: sweep, break, retest
In the strict reading, a bullish breaker needs three things in order. First, price runs below a prior swing low, taking the stops resting there (a liquidity sweep). Second, price reverses and closes back up through the swing high that preceded the run, ideally with large candles and a break of structure. Third, price returns to the down-closing candles of the failed leg, and that zone is watched for support. A bearish breaker is the mirror image.
The loose reading drops the first step and calls any violated order block a breaker. The loose version produces many more zones. Neither reading is the single official one: ICT's own videos are the primary source, and we describe the readings as documented by LuxAlgo's public library, which is a vendor's documentation and not an independent study.
Breaker block vs mitigation block
A mitigation block is described as the same role flip without the liquidity run: the swing fails short of the prior extreme instead of taking it. The strict reading separates the two by the sweep. Many tools and teachers blur them, so when you read a chart or a course, check which rule is being used.
How to mark a breaker block on a chart, step by step
(1) Find the failed zone: an order block, or the down-closing candles of a down leg, that price then overran. (2) For the strict reading, check that a swing high or low was taken first. (3) Confirm the reversal: a close beyond the opposing swing, with large candles. (4) Mark the zone, usually from the high to the low of the failed candle or candles; some authors use bodies only. (5) Wait for price to return to the zone from the other side. (6) Track the zone: it is untouched until the retest, and its far side is the natural place where the idea is considered wrong.
A real breaker block example on a crypto chart
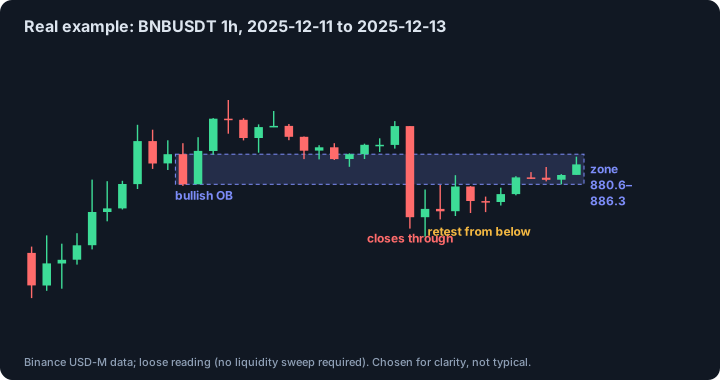
The chart shows a bullish order block on BNBUSDT perpetual, 1h, on 11 to 13 December 2025. The zone spans 880.6 to 886.3. A large candle closed through it, and a few candles later price returned to the zone from below. This follows the loose reading, because we did not require a prior sweep. The case was chosen because it is easy to read. It says nothing about how often such returns end in a reaction.
Why would a failed zone flip? What the research says
The idea behind a breaker block is role reversal: a level that supported price and then broke tends to become resistance. We did not find a peer-reviewed test of role reversal for order block zones, so this part is a hypothesis. Two bodies of research are relevant to the reasoning.
First, support and resistance levels are not empty lines. Carol Osler of the Federal Reserve Bank of New York tested levels published daily by six currency dealing firms from January 1996 to March 1998, for the dollar against the mark, yen and pound, using one-minute quotes. Intraday trends were interrupted at those levels substantially more often than they would have been at arbitrarily chosen levels, and the predictive power lasted at least five business days. Her later work on almost 9,700 stop-loss and take-profit orders at a currency dealing bank found that orders cluster at round numbers and that stop-loss orders cluster just beyond them. This supports the mechanism behind support and resistance in currency markets. It does not test breaker blocks, candle-based zones or crypto.
Second, behavioural finance offers a reason why traders may sell at a level where they were once trapped. Terrance Odean analysed the trading records of 10,000 accounts at a large discount brokerage and found that investors clearly prefer to sell winners rather than losers, which he calls the disposition effect; it was not explained by rebalancing or trading costs. A trader who bought where the order block was, and is now underwater, is the textbook holder of a loser. Odean did not study support and resistance flips, so connecting the two is an interpretation.
How a breaker block is traded and where it is invalidated
As teachers describe it, the retest from the other side is what is traded, not the initial break. Many walk-throughs add confirmation on a lower timeframe rather than a blind limit order at the zone. The far side of the zone is the natural invalidation: if price trades back through the whole zone, the failed-move logic behind the idea no longer holds. This is a description of how the pattern is taught, not advice. Breakers are sometimes respected, sometimes partly violated and sometimes fail outright.
How to test a breaker block rule yourself
Write the rule before you look at results: strict or loose reading, body or range, what counts as a decisive close through the zone, how long the zone stays active, where entry and stop go. Count every zone the rule finds, not only the ones that reacted. Include fees. Split the data in time and build the rule on the first part. Compare with entries at random times that use the same stop and target. If the rule does not beat random entries, the breaker is a description of the chart and not an edge.
Our engine tracks an order block as fresh, mitigated, then invalidated when a candle closes through its far edge. An invalidated zone is the starting point of a breaker, and the chart above marks such a zone. We do not draw breakers as separate objects and we do not require a sweep for the example, so it follows the loose reading.
Common mistakes
- Calling any former zone a breaker without a decisive close through it.
- Naming the breaker by candle colour instead of by its expected role.
- Mixing the strict reading (sweep required) with the loose one in the same analysis.
- Trading the break instead of the retest the idea is about.
- Confusing a breaker with a mitigation block, which has no sweep.
- Assuming the retest always holds.
This page describes a concept, not a signal. We found no peer-reviewed test of these rules; the independent research we did find is listed under Sources.
Sources and further reading
- Osler, C. (2000). Support for resistance: technical analysis and intraday exchange rates. Federal Reserve Bank of New York Economic Policy Review 6(2), 53-68. Levels published by six currency dealing firms, January 1996 to March 1998, dollar against mark, yen and pound, one-minute quotes. Trends were interrupted at these levels substantially more often than at arbitrary levels. We read the full paper.
- Osler, C. (2003). Currency orders and exchange rate dynamics: an explanation for the predictive success of technical analysis. Journal of Finance 58(5), 1791-1819. Working paper version, Federal Reserve Bank of New York Staff Report 125 (2001): almost 9,700 stop-loss and take-profit orders. We read the full working paper.
- Odean, T. (1998). Are investors reluctant to realize their losses? Journal of Finance 53(5), 1775-1798. Records of 10,000 accounts at a large discount brokerage: investors prefer to sell winners over losers (the disposition effect). We read the author's summary page.
- LuxAlgo Library: Breaker Block A vendor's documentation of the strict and loose readings, the difference from a mitigation block and common marking conventions. Not an independent study. We read the page.
- OrderBlock.net: what is an order block The definition, research on order clustering and how to test an order block rule.
See also
Educational material about chart concepts. Not financial advice and not a promise of profit.