
What is a fair value gap (FVG)?
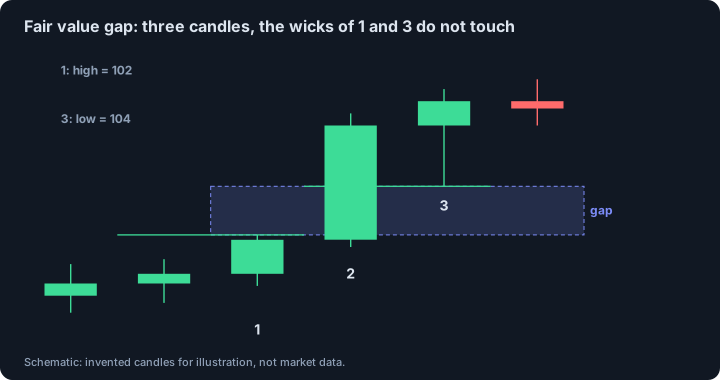
A fair value gap (FVG) is a three-candle pattern where the wicks of the first and third candles do not overlap, leaving an empty price space behind the large middle candle. In a bullish FVG the high of candle 1 is below the low of candle 3; a bearish FVG is the mirror image. Many traders expect price to revisit the gap, but that is an expectation, not a law.
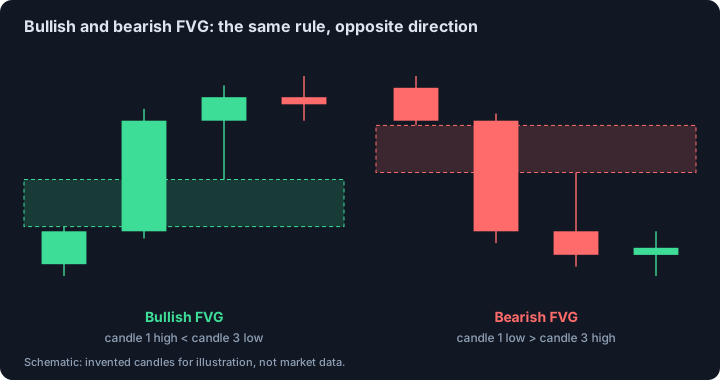
- Rule: bullish FVG when the high of candle 1 is below the low of candle 3; bearish FVG when the low of candle 1 is above the high of candle 3. The gap is the space between the wicks.
- An FVG is not a session gap. It is defined by the candles of the timeframe you chose, so it exists in a market that trades 24 hours a day, and on a lower timeframe the same area contains trades.
- What research says about ordinary gaps: practitioner statistics by Bulkowski show that the type of gap matters (area gaps usually close within a week, breakaway gaps almost never do), and a peer-reviewed 2025 study of weekend gaps in three stock indices found no strong, universal tendency to close gaps at short distances. These are session gaps in stocks, not FVGs. We found no peer-reviewed test of the FVG pattern itself.
Last reviewed: 2026-10-26
How to find an FVG in three steps
Take any three consecutive candles and number them 1, 2, 3 from the oldest. Compare the high of candle 1 with the low of candle 3. If the low of candle 3 is above the high of candle 1, there is a bullish gap between those two prices. Candle 2 is usually large, which is why the middle candle is the one that did the work.
The gap is the area between the two wicks, not between the candle bodies. If the wicks overlap, even slightly, there is no fair value gap by this definition. Where the wicks overlap but the bodies do not, the pattern is called a volume imbalance, which is a different thing.
Bullish and bearish FVG
A bullish FVG appears after a strong up move: the high of candle 1 is below the low of candle 3. A bearish FVG appears after a strong down move: the low of candle 1 is above the high of candle 3. Some ICT material calls them BISI and SIBI (buy-side imbalance, sell-side inefficiency), which are other names for the same shapes.
What happens to a gap: fresh, partly filled, filled
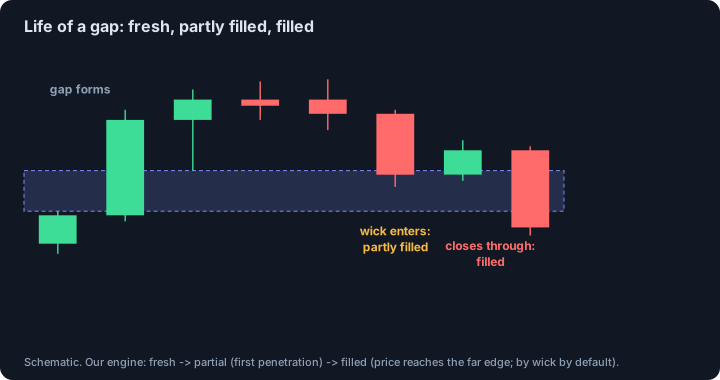
A new gap is fresh. When price returns and enters it, the gap is partly filled. When price travels across it to the far edge, it is filled. Some traders watch the midpoint of the gap, called consequent encroachment, as a reaction level. Different authors count a fill by wick or by close, so state your rule. Our engine counts by wick by default.
A real example on BTCUSDT
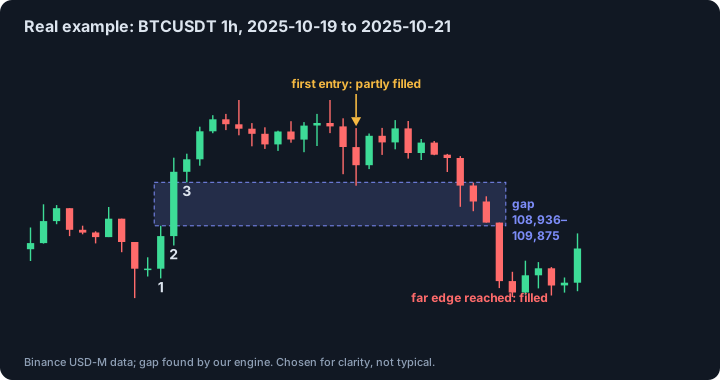
The chart shows a bullish gap found by our engine on BTCUSDT perpetual, 1h, on 19 to 21 October 2025. It spans 108,936 to 109,875. Price first entered it about 13 candles after it formed and reached the far edge 24 candles after it formed. This case was chosen because it is easy to read. Many gaps are filled within a few candles, and some are never filled.
FVG is not a session gap: what the research on gaps says
The old idea that gaps tend to fill comes from session gaps: the jump between one day's close and the next day's open in stocks. Thomas Bulkowski, a practitioner who collected statistics on chart patterns, separates gaps into types. In his figures for bull markets, based on more than 1,100 gaps, 85% of upward area gaps (gaps inside a trading range) close within a week, against 60% of exhaustion gaps, 8% of continuation gaps and 1% of breakaway gaps. The median time to close ranges from 3 to 4 days for area gaps to about 89 days for upward breakaway gaps. These are practitioner statistics, not a peer-reviewed study, and the page does not state the period covered.
A peer-reviewed study by Marnus Janse van Rensburg and Terence Van Zyl (Journal of Risk and Financial Management, 2025) looked at 205 weekend gaps in the Dow Jones Industrial Average, 270 in the NASDAQ and 406 in the DAX, using 5-minute data from 2013 to 2023. They found no strong, universal tendency to close gaps at shorter distances in any of the three indices, with some significant directional patterns at medium to large distances, especially in the DAX.
Two lessons. First, the type of gap matters: a gap that starts a new trend behaves very differently from one inside a range. Second, none of this measures the fair value gap, which is a candle pattern on a continuous market. We found no peer-reviewed test of FVGs, so treat any claim about them as a hypothesis.
Why a gap might matter
The explanation offered is imbalance: a fast move leaves part of the market unfilled, and price tends to come back to trade there. In a limit order book, order flow imbalance is a measured thing: Cont, Kukanov and Stoikov showed that over short intervals price changes are mainly explained by the net flow of orders at the best bid and ask. That is a statement about the order book over short intervals, not about a three-candle pattern on an hourly chart. A candlestick chart does not show unfilled orders, so the link is an interpretation.
How to test an FVG rule yourself
Write the rule before you look at results: timeframe, minimum gap size in ATR, entry at the edge, the midpoint or after confirmation, stop and target. Count every gap the rule finds. Include fees. Split the data in time and build the rule on the first part. Compare with entries at random times with the same stop and target. A gap that is filled most of the time is not enough: the stop and target decide the result.
We use the three-candle rule: bullish when the high of candle 1 is below the low of candle 3, bearish when the low of candle 1 is above the high of candle 3. The gap is known at the close of candle 3. Its state moves from fresh to partly filled at the first penetration and to filled when price reaches the far edge, measured by the wick by default. A state change is never revised afterwards.
Common mistakes
- Calling any big candle a fair value gap. Without non-overlapping wicks there is no gap.
- Forgetting the timeframe: a gap on 1h may be full of trades on 1m.
- Assuming every gap must be filled. Research on ordinary gaps shows that the type of gap decides how long it stays open.
- Trading every gap. In a strong trend many gaps are never revisited.
- Assuming a filled gap must lead to a reversal.
This page describes a concept, not a signal. We found no peer-reviewed test of these rules; the independent research we did find is listed under Sources.
Sources and further reading
- Bulkowski, T. Gaps. thepatternsite.com Practitioner statistics on gap types: share closing within a week and median time to close, bull market, more than 1,100 gaps. Not peer-reviewed; the period covered is not stated. We read the page.
- Janse van Rensburg, M. and Van Zyl, T. (2025). Price gaps and volatility: do weekend gaps tend to close? Journal of Risk and Financial Management 18(3), 132. Weekend gaps in the DJIA, NASDAQ and DAX, 2013 to 2023, 5-minute data. No strong universal tendency to close gaps at short distances. We read the abstract and data description from the university repository.
- OrderBlock.net: order flow imbalance and price impact Our summary of Cont, Kukanov and Stoikov (2014) on how net order flow at the best bid and ask explains short-term price changes.
See also
Educational material about chart concepts. Not financial advice and not a promise of profit.