
What is optimal trade entry (OTE)?
Optimal trade entry (OTE) is a retracement band, commonly given as 62 to 79 percent of the last impulse leg, where ICT-style entries are looked for after a pullback. The 70.5 percent level, the midpoint of the band, is often marked as the preferred price. It is a Fibonacci-style measuring tool, and the ratios have no inherent power: price may never reach the band, or may cut straight through it.
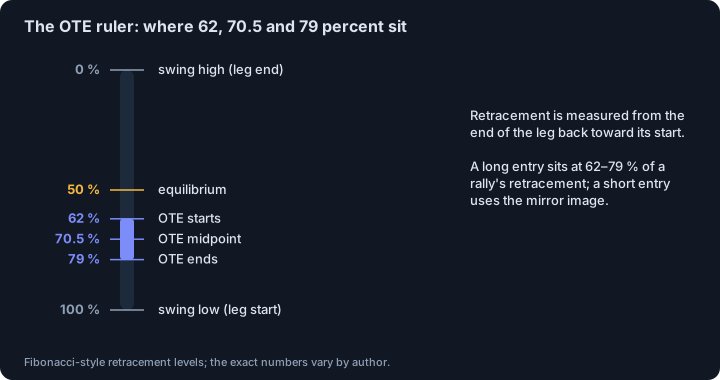
- Definition: the span between the 61.8 or 62 percent and 79 percent pullback of an impulsive leg, with 70.5 percent as an optional midline. The band as a whole matters more than any single level.
- Measuring: for a long, anchor from the swing low to the swing high of a clear impulse leg; the pullback is measured from the high back toward the low. For a short, mirror it.
- Prerequisites in the conventional sequence: a liquidity sweep, then a structure shift, then a retracement into the band. An OTE touch in a quiet, untested range is considered a weaker setup.
- OTE is not the golden pocket: the golden pocket is narrower and shallower (0.618 to 0.65) and assumes none of those prerequisites.
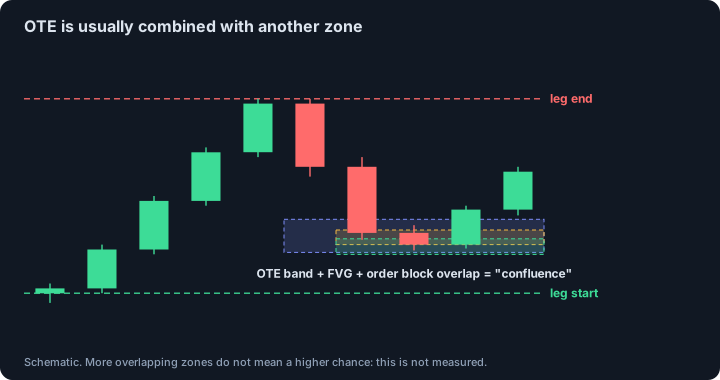
- Confluence (an order block or fair value gap inside the band) is common. It makes the picture tidier; no study we found shows it raises the chance of a reaction.
- Research on Fibonacci retracements is thin and mixed: one algorithmic study of three equity markets linked Fibonacci zones to more price bounces but found no statistical difference from non-Fibonacci zones; another study with a small sample found a Fibonacci-based strategy beat buy-and-hold. We found no peer-reviewed test of OTE.
Last reviewed: 2026-10-26
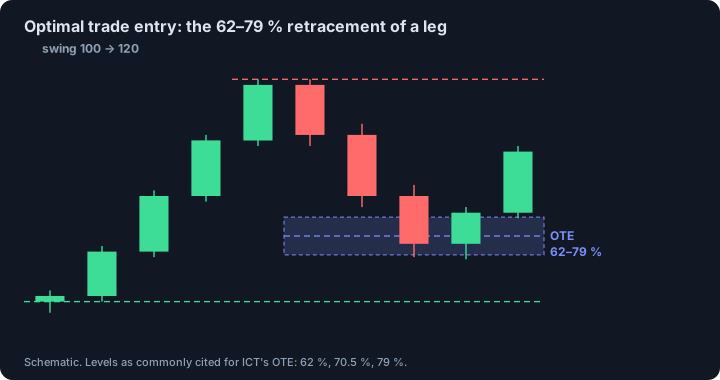
What is optimal trade entry?
Optimal trade entry is an ICT retracement band: the span between the 61.8 percent and 79 percent pullback of an impulsive price leg, usually written 62 to 79 percent. Many traders also mark 70.5 percent, the midpoint, as a preferred entry price. The idea is to wait for a pullback after a strong move instead of chasing the breakout, and to look for an entry deep in the pullback, where the distance to a stop beyond the start of the leg is short.
How to measure the OTE zone, step by step
(1) Pick a clear impulse leg: a strong move that breaks structure in the intended direction, with an obvious swing low and swing high. Choppy, overlapping price action does not produce a meaningful band. (2) For a long, anchor a Fibonacci retracement from the swing low to the swing high; for a short, from the swing high to the swing low. (3) The zone is the area between the 0.62 and 0.79 levels, with 0.705 as an optional midline. For a rally from 100 to 120 the band is about 107.6 down to 104.2, with the midpoint near 105.9.
The prerequisites: sweep, shift, then retracement
In the conventional sequence, OTE is applied after displacement. A liquidity sweep comes first, then a structure shift, then the retracement into the band. A touch of the band in a quiet, untested range is considered a weaker setup, and ignoring the prerequisite sweep and structure shift is a frequent error. Risk is usually placed beyond the swing that anchors the measurement, and targets can reference that swing first, then extension levels beyond it. Deeper entries generally produce tighter stops relative to targets.
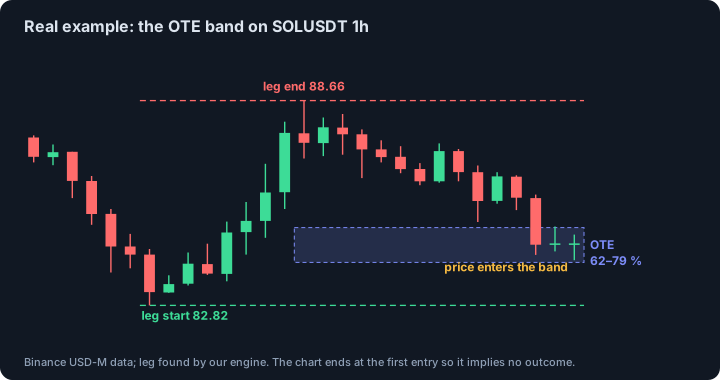
A real example on SOLUSDT
The chart shows SOLUSDT perpetual, 1h, on 9 to 10 February 2026. The leg runs from 82.82 to 88.66, and the 62 to 79 percent band is shaded. The chart stops at the first candle that reaches the band, on purpose: it illustrates how the zone is drawn and says nothing about what price did next. The leg was found by our engine and chosen because it is easy to read.
OTE vs the golden pocket and plain Fibonacci levels
Treating OTE as interchangeable with the golden pocket is a mistake. The golden pocket is narrower and shallower (about 0.618 to 0.65) and does not assume the prerequisites. Some templates use the classical 0.618 and 0.786 ratios; others use 0.62 and 0.79. The exact numbers vary slightly between sources, so check what yours uses. The 62 to 79 percent band sits inside the discount half of a rally by construction, which links it to premium and discount.
Confluence: OTE with order blocks and fair value gaps
Confluence strengthens the setup in the teaching: an order block, a fair value gap or a session level inside the band makes the location more compelling, and many models require the overlap. More overlapping tools give a neater picture. No study we found shows that overlap raises the chance of a reaction, so read confluence as a way to choose a specific price, not as a probability.
What research says about Fibonacci retracements
The evidence is limited and mixed. Carol Osler of the Federal Reserve Bank of New York notes in her paper on support and resistance that analysts use Fibonacci series, with 38.2 and 61.8 percent retracements said to be common, and she tested levels published by six currency dealing firms whose explanations included such approaches. The levels as a group predicted intraday trend interruptions in 1996 to 1998; her test did not isolate Fibonacci ratios.
A study in Expert Systems with Applications (volume 187, 2022) proposed an algorithm to identify Fibonacci retracements in three equity markets and built zones around their levels. It reports a positive relationship between the zones and the probability of price bounces, but price behaviour on Fibonacci and non-Fibonacci zones did not differ statistically. A paper by Ikhlaas Gurrib, Mohammad Nourani and Rajesh Kumar Bhaskaran (Financial Innovation, 2022), on US energy stocks and energy cryptocurrencies from November 2017 to January 2020, found that Fibonacci retracements tracked energy stock prices better than crypto prices, and that a Fibonacci-based strategy returned more than buy-and-hold in that sample. The sample is short and narrow, and the result does not test OTE.
Together: some bounce effect has been reported, the specific ICT band has not been tested, and results differ by market.
How to test an OTE rule yourself
Write the rule before you look at results: how the leg is chosen, which ratios, whether a sweep and shift are required, entry as a limit order or after confirmation, stop and target. Count every leg the rule finds, including the ones where price never reached the band. Include fees. Split the data in time and compare with entries at random retracement depths that use the same stop and target. If the 62 to 79 percent band does no better than other depths, the zone is a description and not an edge.
We do not draw OTE zones in the scanner. They are a simple calculation on a leg: level = high − ratio × (high − low) for a long, and the mirror for a short. The leg on the chart above was found by our engine.
Common mistakes
- Moving the swing points after the fact so the zone fits.
- Measuring a drifting or overlapping move: the band is meaningless without a clear impulse.
- Expecting the pullback to reach the zone every time.
- Skipping the prerequisite sweep and structure shift the sequence assumes.
- Treating OTE as interchangeable with the golden pocket.
- Treating confluence as a probability.
This page describes a concept, not a signal. We found no peer-reviewed test of these rules; the independent research we did find is listed under Sources.
Sources and further reading
- LuxAlgo Library: Optimal Trade Entry. A vendor's documentation: the 62 to 79 percent band, 70.5 percent, prerequisites, confluence, difference from the golden pocket. Not an independent study. We read the page.
- LuxAlgo Library: Premium & Discount. OTE sits below equilibrium by construction; arrays ranked by depth. Not an independent study. We read the page.
- Osler, C. (2000). Support for resistance: technical analysis and intraday exchange rates. Federal Reserve Bank of New York Economic Policy Review 6(2), 53-68. Mentions Fibonacci retracements among the methods analysts use; published levels predicted intraday trend interruptions, 1996 to 1998. We read the full paper.
- Gurrib, I., Nourani, M. and Bhaskaran, R. K. (2022). Energy crypto currencies and leading U.S. energy stock prices: are Fibonacci retracements profitable? Financial Innovation 8. US energy stocks and energy cryptocurrencies, November 2017 to January 2020; a short, narrow sample. We read the abstract page.
- Automatic identification and evaluation of Fibonacci retracements: empirical evidence from three equity markets. Expert Systems with Applications 187 (2022), 115893. Zones around Fibonacci levels linked to more bounces, with no statistical difference from non-Fibonacci zones. We read the abstract as quoted in an index; we did not confirm the author list.
- OrderBlock.net: premium and discount The dealing range and the discount half where the band sits.
See also
Educational material about chart concepts. Not financial advice and not a promise of profit.