
What is liquidity in ICT and smart money?
In smart money and ICT language, liquidity means resting orders that cluster at obvious prices, mostly stop orders just above old highs (buy-side liquidity) and just below old lows (sell-side liquidity). The idea is that large traders need many opposite orders to fill big positions, so price is drawn to those clusters. Order clustering at obvious prices is documented; the claim that price is drawn to it is an interpretation, because a chart does not show the order book.
- Two meanings of the word: market liquidity (how easily you can trade without moving price) and, in ICT and smart money, pools of resting orders, mainly stops, above highs and below lows.
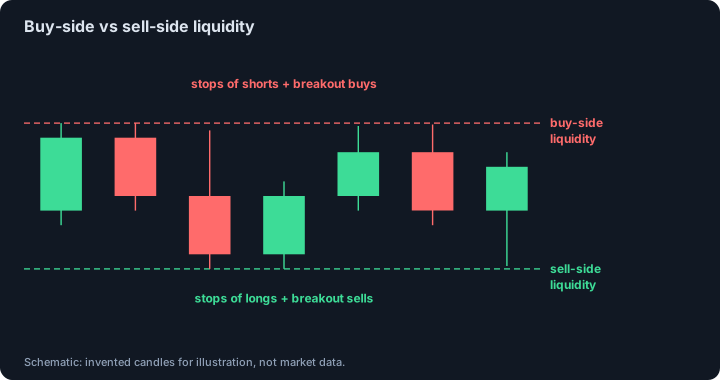
- Buy-side liquidity sits above highs (stops of short sellers, breakout buy orders). Sell-side liquidity sits below lows (stops of long holders, breakout sell orders).
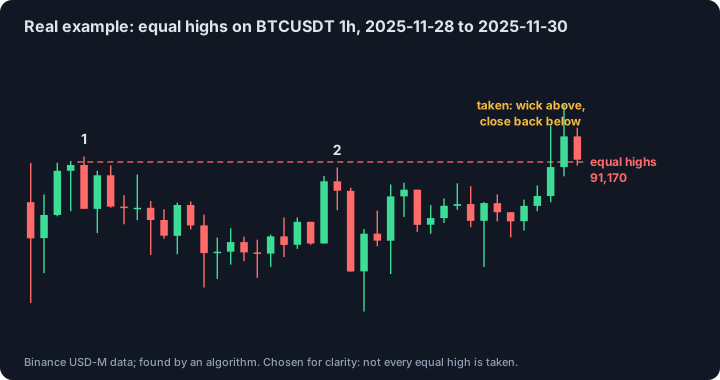
- Equal highs and equal lows (two or more swings at nearly the same price, within a small fraction of ATR) are the classic pools. Stops gather in a band, not at one price.
- What research shows: an analysis of almost 9,700 currency stop-loss and take-profit orders found strong clustering at round numbers, with stop-loss orders just beyond them (Federal Reserve Bank of New York). Limit orders on Euronext and Bitcoin prices also cluster at round numbers.
- What it does not show: that price is deliberately drawn to a pool. A study of Bitcoin found no significant pattern of returns after round-number prices.
- A candlestick chart shows traded prices, not resting orders. A liquidity map is a model of where orders probably sit.
Last reviewed: 2026-10-26
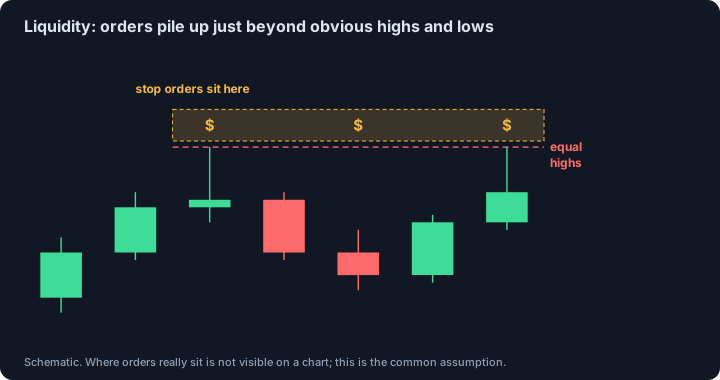
What is liquidity? Two meanings of the word
In ordinary market language, liquidity is how easily an asset can be bought or sold without moving the price: a liquid market has many orders close to the current price. In ICT and smart money concepts the word is used differently. It means pools of resting orders that sit at prices traders can see on a chart, mainly stop-loss orders and breakout entries. The two meanings are related, because both are about orders waiting in the market, but they are not the same thing. This page is about the second meaning.
Buy-side liquidity and sell-side liquidity
Above a high sit buy stop orders of traders who are short and buy orders of breakout traders. This is called buy-side liquidity (BSL). Below a low sit the sell stop orders of traders who are long and the sell orders of breakout traders. This is sell-side liquidity (SSL). The name tells you which orders are resting there, not which way price will go afterwards.
Equal highs and equal lows: how liquidity pools are marked
Equal highs are two or more swing highs that stall at nearly the same price; equal lows are the mirror image. Classical charting reads them as a level that has held. The liquidity reading treats them as a place where many stops are stacked just beyond. There is no fixed tolerance: practitioners accept highs within a few ticks or within a small fraction of the average true range (ATR) of each other, and note that stops gather in a band rather than at one exact price, so a zone is more honest than a line. There should be a meaningful pullback between the swings, so they read as separate tests.
Other places that are marked as pools are the previous day's, week's and month's highs and lows, session extremes and the edges of a range. Pools on higher timeframes are usually considered more important than pools on a one-minute chart because more traders see them. Some equal levels are genuinely defended and are never taken, and a pool can also be taken weeks later, so a marked pool is not a prediction.
Where do stop orders sit? What the research shows
The strongest evidence comes from a study by Carol Osler of the Federal Reserve Bank of New York. She analysed almost 9,700 stop-loss and take-profit orders placed at a large currency dealing bank between September 1999 and April 2000. Take-profit orders clustered at round numbers: 9.3% of them were at rates ending exactly in 00, against 4.4% of stop-loss orders. Stop-loss orders clustered just beyond round numbers: 14.4% of stop-loss buy orders sat just above a round number (01 to 10) against 7.4% just below it (90 to 99). In a follow-up on the same bank's orders, almost 10% of all orders sat at rates ending in 00.
Clustering is not limited to currencies. A paper by David Bourghelle and Alexis Cellier on Euronext found widespread clustering of trade prices and limit order prices at round increments and argued that this creates price barriers; the next strongest clustering appeared just beyond the round levels. Andrew Urquhart (Economics Letters, 2017) found significant clustering of Bitcoin prices at round numbers, with more than 10% of prices ending in 00.
Read the limits. These studies show that orders and prices cluster at obvious levels. None of them shows that a pool defined by two equal highs on a candle chart works the same way, and the order data come from one currency bank in 1999 to 2000. We found no peer-reviewed study of ICT-style liquidity pools.
How stop orders behave on a crypto exchange
What happens when price reaches a pool depends on the order type. On Binance Futures, a stop-market order becomes a market order when the stop price is reached and executes immediately at the best available price, and Binance warns that market orders can slip because they take liquidity from the order book. A stop-limit order places a limit order at the chosen price or better once the stop price is reached. So triggered stop-market orders add market orders to the book at the moment price reaches the level, which is the mechanism behind the cascades described in the next section. A liquidation is a related forced order: see our article on futures liquidation.
Does price get drawn to liquidity? What is known and what is not
Osler's study of stop-loss orders and price cascades found that exchange-rate trends are unusually rapid when rates reach levels at which stop-loss orders have been documented to cluster, that the response to stop-loss orders is larger and lasts longer than the response to take-profit orders, and that most results are significant for hours but not for days. Stop-loss orders generate positive-feedback trading: a triggered stop pushes price further through the level. This is real evidence for the mechanism that a pool of stops can accelerate a move once price reaches it.
What it does not show is intent. Nothing in these studies shows that anyone moves price to a pool on purpose, and a chart cannot show intent. The Bitcoin study found no significant pattern of returns after round-number prices. So the honest summary is: orders cluster, stops can add fuel when a level breaks, and whether price is drawn to a particular pool is not established.
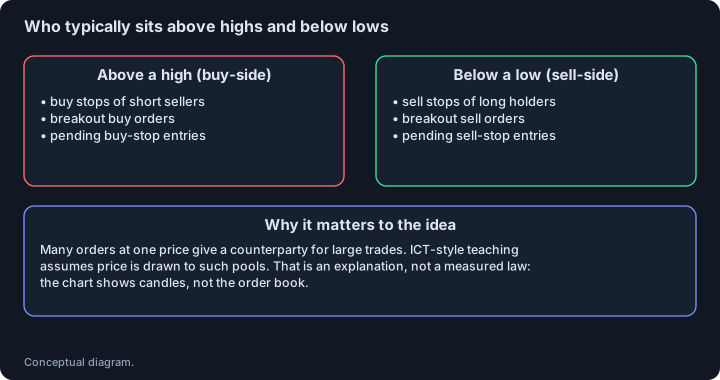
How liquidity is used in ICT-style analysis
In the teaching, pools do two jobs. They are used as targets: an untouched pool above or below price is treated as a place price may travel to. And they are used as context: a pool that has just been swept, followed by a structure shift, is read as a possible reversal. Both uses are readings of a chart, and both depend on how you mark the pool. See the liquidity sweep page for the second use.
Liquidity vs order book depth
The depth of the limit order book is a measured quantity: the exchange shows the resting limit orders at each price. Stop orders and hidden orders are not in that display. Research on the book itself exists: Cont, Kukanov and Stoikov showed that net order flow at the best bid and ask explains short-term price changes, and that the effect is stronger when the book is thin. That says something about the visible book over short intervals. It does not validate pools of stops marked on a chart.
How to test a liquidity idea yourself
Define the pool before you look at results: how many touches, what tolerance in ATR, which timeframe, how recent. Count every pool the rule marks, not only the ones that were taken. For each, record what happened next over a fixed horizon, and compare with levels placed at random distances from price. Split the data in time. If marked pools do no better than random levels, the pool is a description of the chart and not a forecast.
We do not claim to see stop orders. Our engine marks equal highs and equal lows, which are at least two swings of the same kind within 0.25 × ATR of each other, and tracks them as active, swept or broken. These are chart facts that stand in for where stops may sit; the chart above shows one such level.
Common mistakes
- Believing a drawn liquidity pool is visible data. It is a guess about where orders sit.
- Treating every level as liquidity. The idea is about a few obvious levels.
- Drawing a precise line when stops gather in a band.
- Using hindsight: after a reversal almost any prior high looks like a target.
- Reading equal highs as a directional signal without context: they are not bullish or bearish by themselves.
This page describes a concept, not a signal. We found no peer-reviewed test of these rules; the independent research we did find is listed under Sources.
Sources and further reading
- Osler, C. (2003). Currency orders and exchange rate dynamics: an explanation for the predictive success of technical analysis. Journal of Finance 58(5), 1791-1819. Working paper version, Federal Reserve Bank of New York Staff Report 125 (2001): almost 9,700 stop-loss and take-profit orders, September 1999 to April 2000. We read the full working paper.
- Osler, C. (2002). Stop-loss orders and price cascades in currency markets. Federal Reserve Bank of New York Staff Report 150. Rates trend unusually fast at levels where stop-loss orders cluster; most results significant for hours, not days. We read the full paper.
- Bourghelle, D. and Cellier, A. (2007). Limit order clustering and price barriers on financial markets: empirical evidence from Euronext. EFMA annual meeting paper. Clustering of trade and limit order prices at round increments on Euronext; argues it creates price barriers. A conference paper, not necessarily peer-reviewed. We read the abstract and introduction.
- Urquhart, A. (2017). Price clustering in Bitcoin. Economics Letters 159, 145-148. Significant clustering of Bitcoin prices at round numbers, over 10% ending in 00; no significant pattern of returns after round-number prices. We read the abstract.
- Binance Support: Types of Order on Binance Futures. Official description of stop-limit and stop-market orders and the slippage warning for market orders. We read the page.
- LuxAlgo Library: Equal Highs/Lows as Liquidity. A vendor's documentation of the liquidity reading, tolerance and caveats. Not an independent study. We read the page.
- OrderBlock.net: order flow imbalance and price impact Our summary of Cont, Kukanov and Stoikov (2014) on the visible order book.
- OrderBlock.net: futures liquidation explained How forced orders work on futures exchanges.
See also
Educational material about chart concepts. Not financial advice and not a promise of profit.