
What are ICT kill zones?
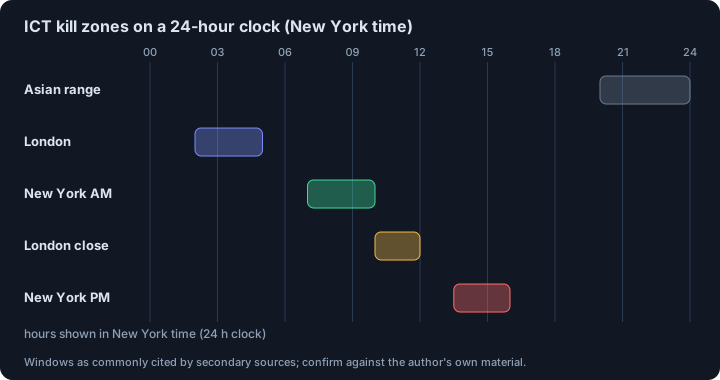
ICT kill zones are fixed intraday time windows, mostly around the London and New York sessions, in which the ICT teaching expects institutional participation and stronger directional moves to concentrate. Commonly cited windows in New York time are London 02:00 to 05:00, New York morning 07:00 to 10:00, London close 10:00 to 12:00 and New York afternoon 13:30 to 16:00. Sources differ on the edges by 30 to 90 minutes, and a kill zone says when to look, not what to trade.
- Windows (New York time, approximate): Asian about 20:00 to 24:00, London open 02:00 to 05:00, New York AM 07:00 to 10:00, London close 10:00 to 12:00, New York PM 13:30 to 16:00. Sources differ on boundaries by 30 to 90 minutes, so treat the edges as soft.
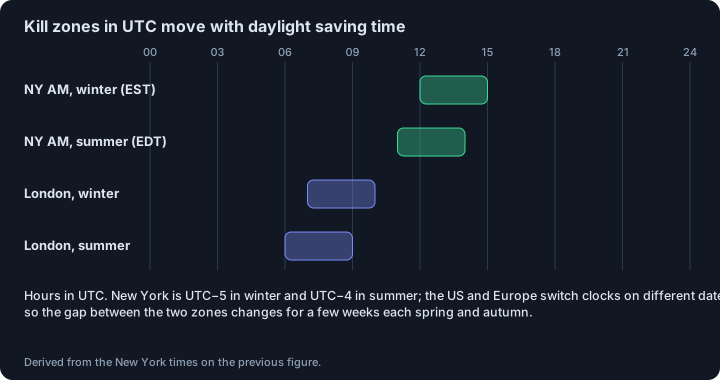
- They are defined on the New York clock. In UTC the New York morning window is 12:00 to 15:00 in winter and 11:00 to 14:00 in summer.
- Research does show time-of-day patterns: a 1997 study found pervasive intraday periodicity in return volatility in foreign exchange and equity markets, and a 2019 study of Bitcoin found volume, volatility and liquidity vary through the day, with volatility and liquidity highest around the openings of major stock markets and thin in the early morning (GMT).
- Busy hours are not the same as profitable hours, and we found no peer-reviewed test of the specific ICT windows.
- The windows were built around forex and index futures. Vendor documentation notes that the effect is weaker and less consistent in stocks and crypto and advises testing on your instrument.
- Use: a time filter under a price model, never a signal by itself.
Last reviewed: 2026-10-26
What are kill zones in ICT?
A kill zone is a fixed intraday time window in which the ICT approach expects institutional participation and stronger directional moves to concentrate. The idea is that most of the day's price movement comes from a few hours when the major financial centres are active, so a setup that forms inside such a window is considered more meaningful than the same setup in a quiet hour. Kill zones are a time filter. They need a price-based model, such as structure or liquidity, behind them.
Kill zone times in New York time
The windows are quoted in New York time. The Asian window, roughly 20:00 to 24:00, is often described as a range-building period that later sessions trade through. The London open, roughly 02:00 to 05:00, is described as often setting the day's high or low, sometimes through a false push known as a Judas swing. New York AM, roughly 07:00 to 10:00, typically extends or reverses London's move and contains the major US data releases. London close, roughly 10:00 to 12:00, is often a corrective phase, and New York PM, roughly 13:30 to 16:00, the final push before the close. These descriptions are how the teaching characterises the windows, not measured facts.
Sources disagree on the boundaries by 30 to 90 minutes. Treat the edges as soft and pick the two or three windows you can watch consistently, not all of them.
Converting kill zone times to UTC and your time zone
New York is UTC−5 in winter and UTC−4 in summer. The US and Europe change clocks on different dates, so for a few weeks each spring and autumn the gap between London and New York is an hour different from the rest of the year. A visitor outside the US sees the windows shift by an hour twice a year, and the offset changes in the weeks when the US and the UK switch clocks on different dates. The practical rule is to set your chart to the America/New_York time zone, so the windows stay aligned through daylight-saving changes, or to convert with a tool that knows the date and not with a fixed offset. Leaving the chart on UTC or local time puts the windows on the wrong candles.
Kill zone times in UTC: winter and summer
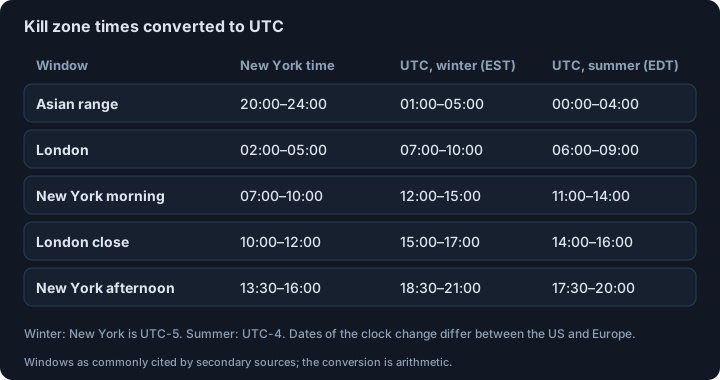
In winter, with New York at UTC−5, the London window is 07:00 to 10:00 UTC, New York morning is 12:00 to 15:00, London close is 15:00 to 17:00 and New York afternoon is 18:30 to 21:00. In summer, with New York at UTC−4, the same windows are one hour earlier in UTC: 06:00 to 09:00, 11:00 to 14:00, 14:00 to 16:00 and 17:30 to 20:00. The Asian window is 01:00 to 05:00 UTC in winter and 00:00 to 04:00 in summer. These conversions are arithmetic on the commonly cited New York times.
What research says about intraday patterns
The time-of-day pattern in markets is real and documented. Torben Andersen and Tim Bollerslev, in the Journal of Empirical Finance in 1997, examined foreign exchange and equity markets and described a pervasive intraday periodicity in return volatility that strongly shapes the behaviour of high-frequency returns; they argue it has to be modelled explicitly before the underlying volatility dynamics can be identified.
For Bitcoin, Andrea Eross, Frank McGroarty, Andrew Urquhart and Simon Wolfe (Research in International Business and Finance, 2019) used about four years of tick data from the leading Bitcoin exchange by information share, aggregated to 5-minute intervals and time-stamped in GMT. They report that volume rises through the day and falls from about 4 pm until midnight, a pattern like that in currency markets; that realised volatility is fairly steady across the day but highest at the openings of the three major global stock markets; and that liquidity is highest at those openings and thinnest in the early morning.
This supports the general idea that time of day matters for activity. It does not test the ICT windows, and more activity is not the same as a better trade.
Do kill zones work for crypto?
The windows were built around forex and index futures with clear session opens. Crypto trades all day, so time of day matters through who is active, not through an opening bell. The vendor documentation we read says the effect is weaker and less consistent in stocks and crypto and advises testing on your instrument. We found no peer-reviewed study of ICT kill zones in any market. If you use them on crypto, test the time filter on its own first.
How kill zones are used: a time filter, not a signal
As a time filter for entry models, on the idea that a setup without session participation is less meaningful. To frame the day as a cycle that moves from range-building to a run on one side and then to delivery. As a base for named time models and for projecting session highs and lows as targets. The documentation stresses that kill zones say when to look, not what to trade: a time filter under a price model, never a signal by itself.
How to test a time filter yourself
Write the rule before you look at results: which windows, in which time zone, which price model sits under the filter. Take the trades the price model would take at all hours, and compare results inside the windows with results outside them, with fees included and the data split in time. If setups inside the windows do no better than the same setups elsewhere, the windows describe when the market is busy and add nothing to the model.
Our scanner does not filter by session. The conversion table shows the same windows in New York time and in UTC, with and without daylight saving time.
Common mistakes
- Leaving the chart on UTC or local time, which puts the windows on the wrong candles.
- Forgetting the daylight saving changes, and that the US and Europe switch on different dates.
- Treating a kill zone as a signal, or taking random trades just because they fall inside one.
- Assuming exact switch times when sources disagree by 30 to 90 minutes.
- Marking every window instead of the two or three you can watch consistently.
- Assuming a busy hour is a profitable hour.
This page describes a concept, not a signal. We found no peer-reviewed test of these rules; the independent research we did find is listed under Sources.
Sources and further reading
- LuxAlgo Library: ICT Killzones. A vendor's documentation: the windows in New York time, soft boundaries, caveats for stocks and crypto, common mistakes. Not an independent study. We read the page.
- Andersen, T. G. and Bollerslev, T. (1997). Intraday periodicity and volatility persistence in financial markets. Journal of Empirical Finance 4(2-3), 115-158. Pervasive intraday periodicity in return volatility in foreign exchange and equity markets. We read the abstract as published on a university page; the full text is paywalled.
- Eross, A., McGroarty, F., Urquhart, A. and Wolfe, S. (2019). The intraday dynamics of bitcoin. Research in International Business and Finance 49, 71-81. About four years of tick data from the leading Bitcoin exchange, 5-minute intervals, GMT: volume, volatility and liquidity by time of day. We read the abstract.
- OrderBlock.net: what is a liquidity sweep The sweep that kill zone models often look for.
- OrderBlock.net: premium and discount Discount entries ranked higher inside the windows in some models.
See also
Educational material about chart concepts. Not financial advice and not a promise of profit.